
Imfuna

Facility & Asset Management

Every issue, across every building, in one place

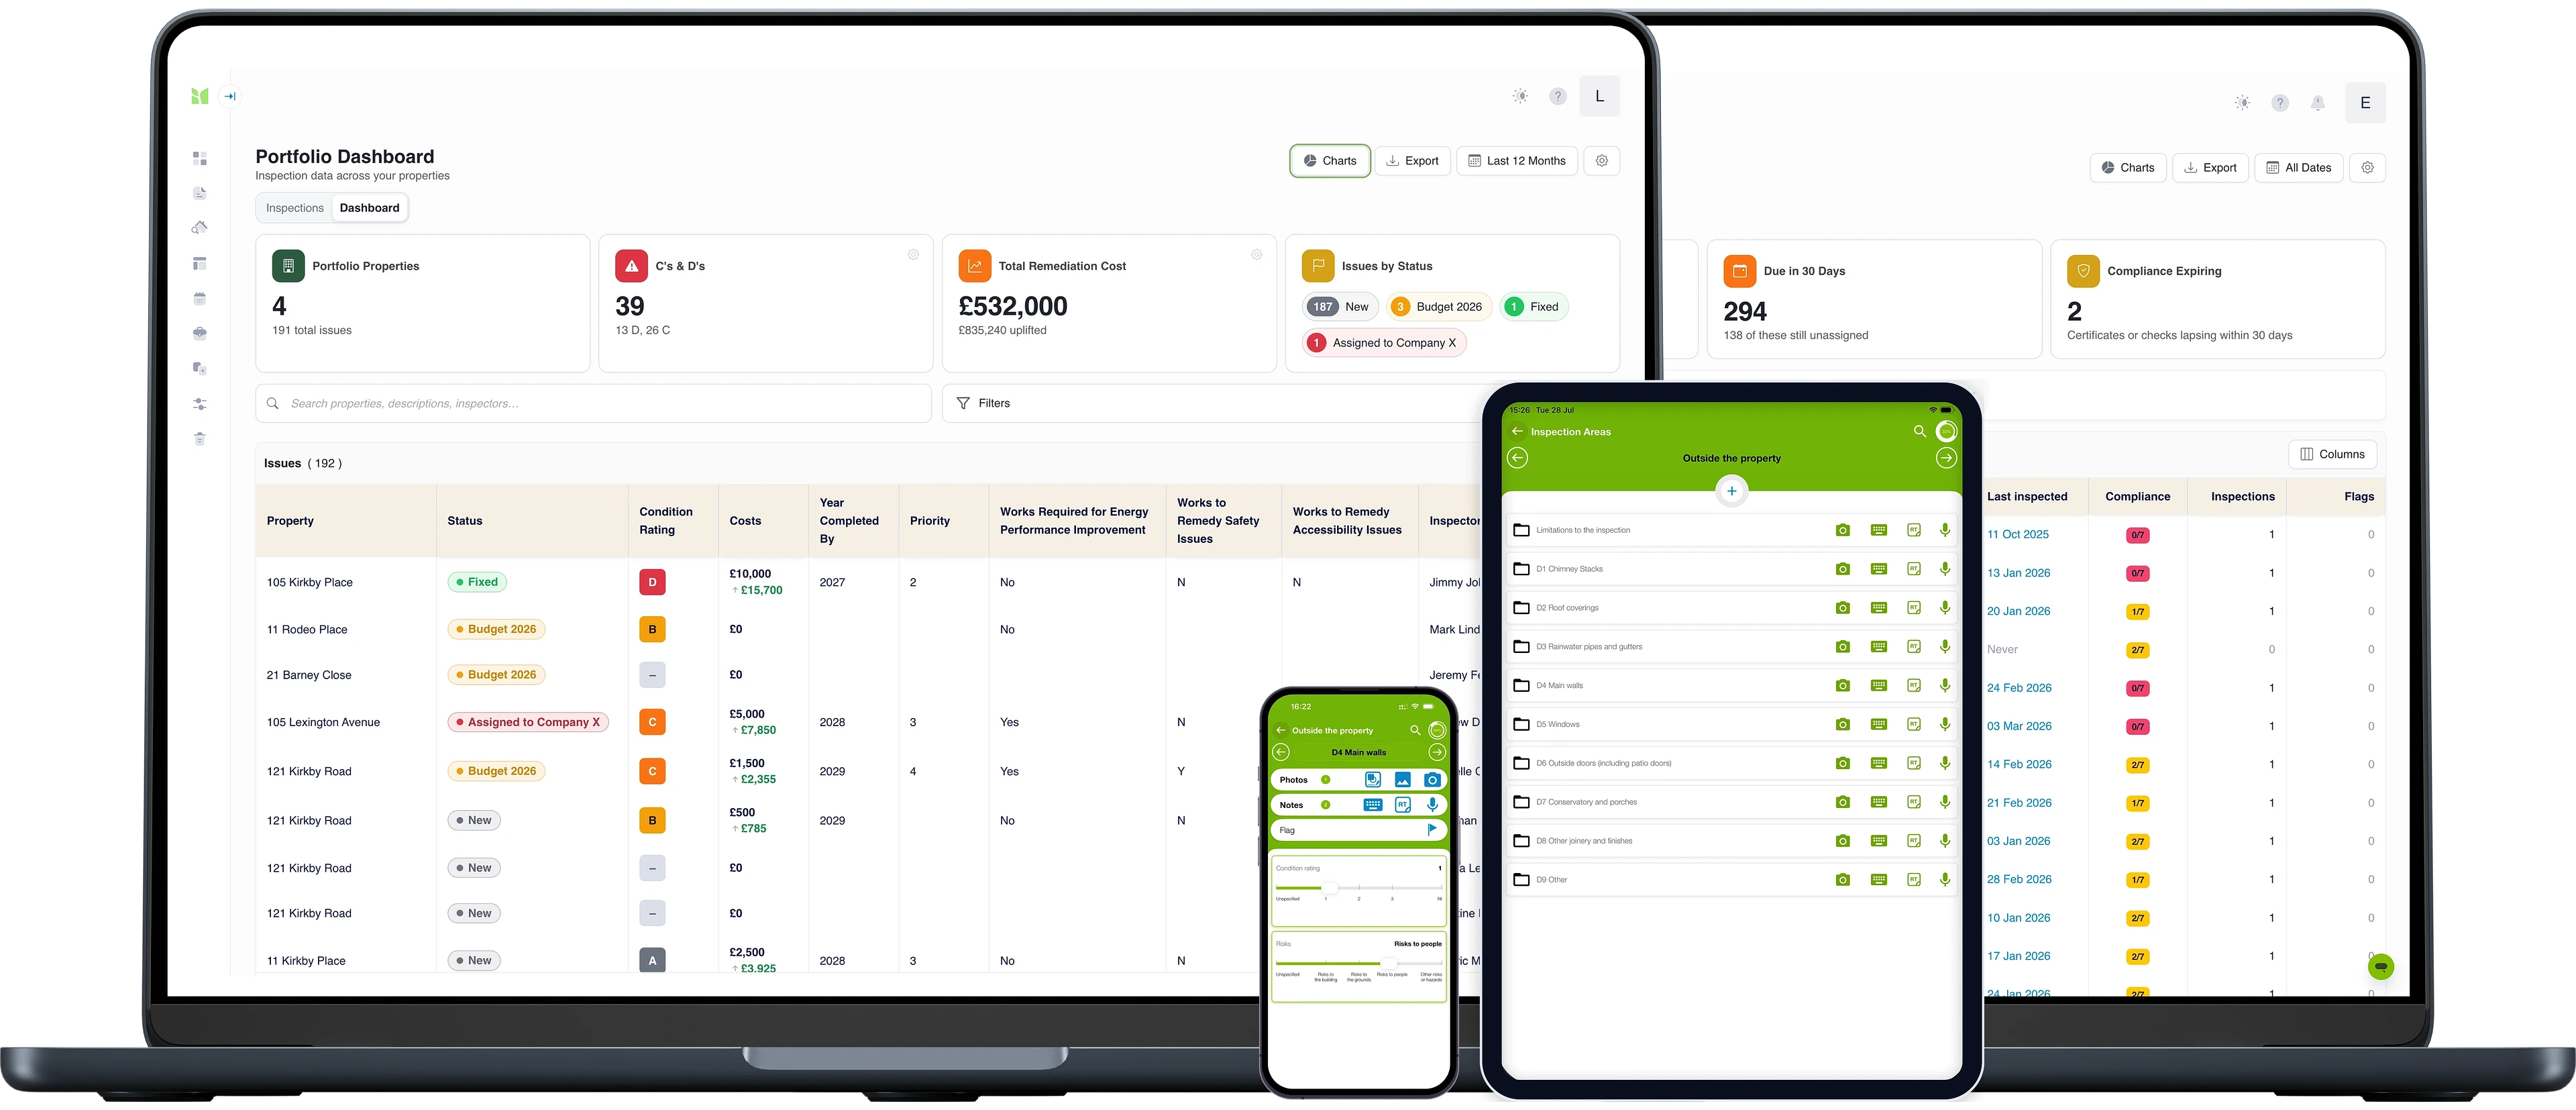
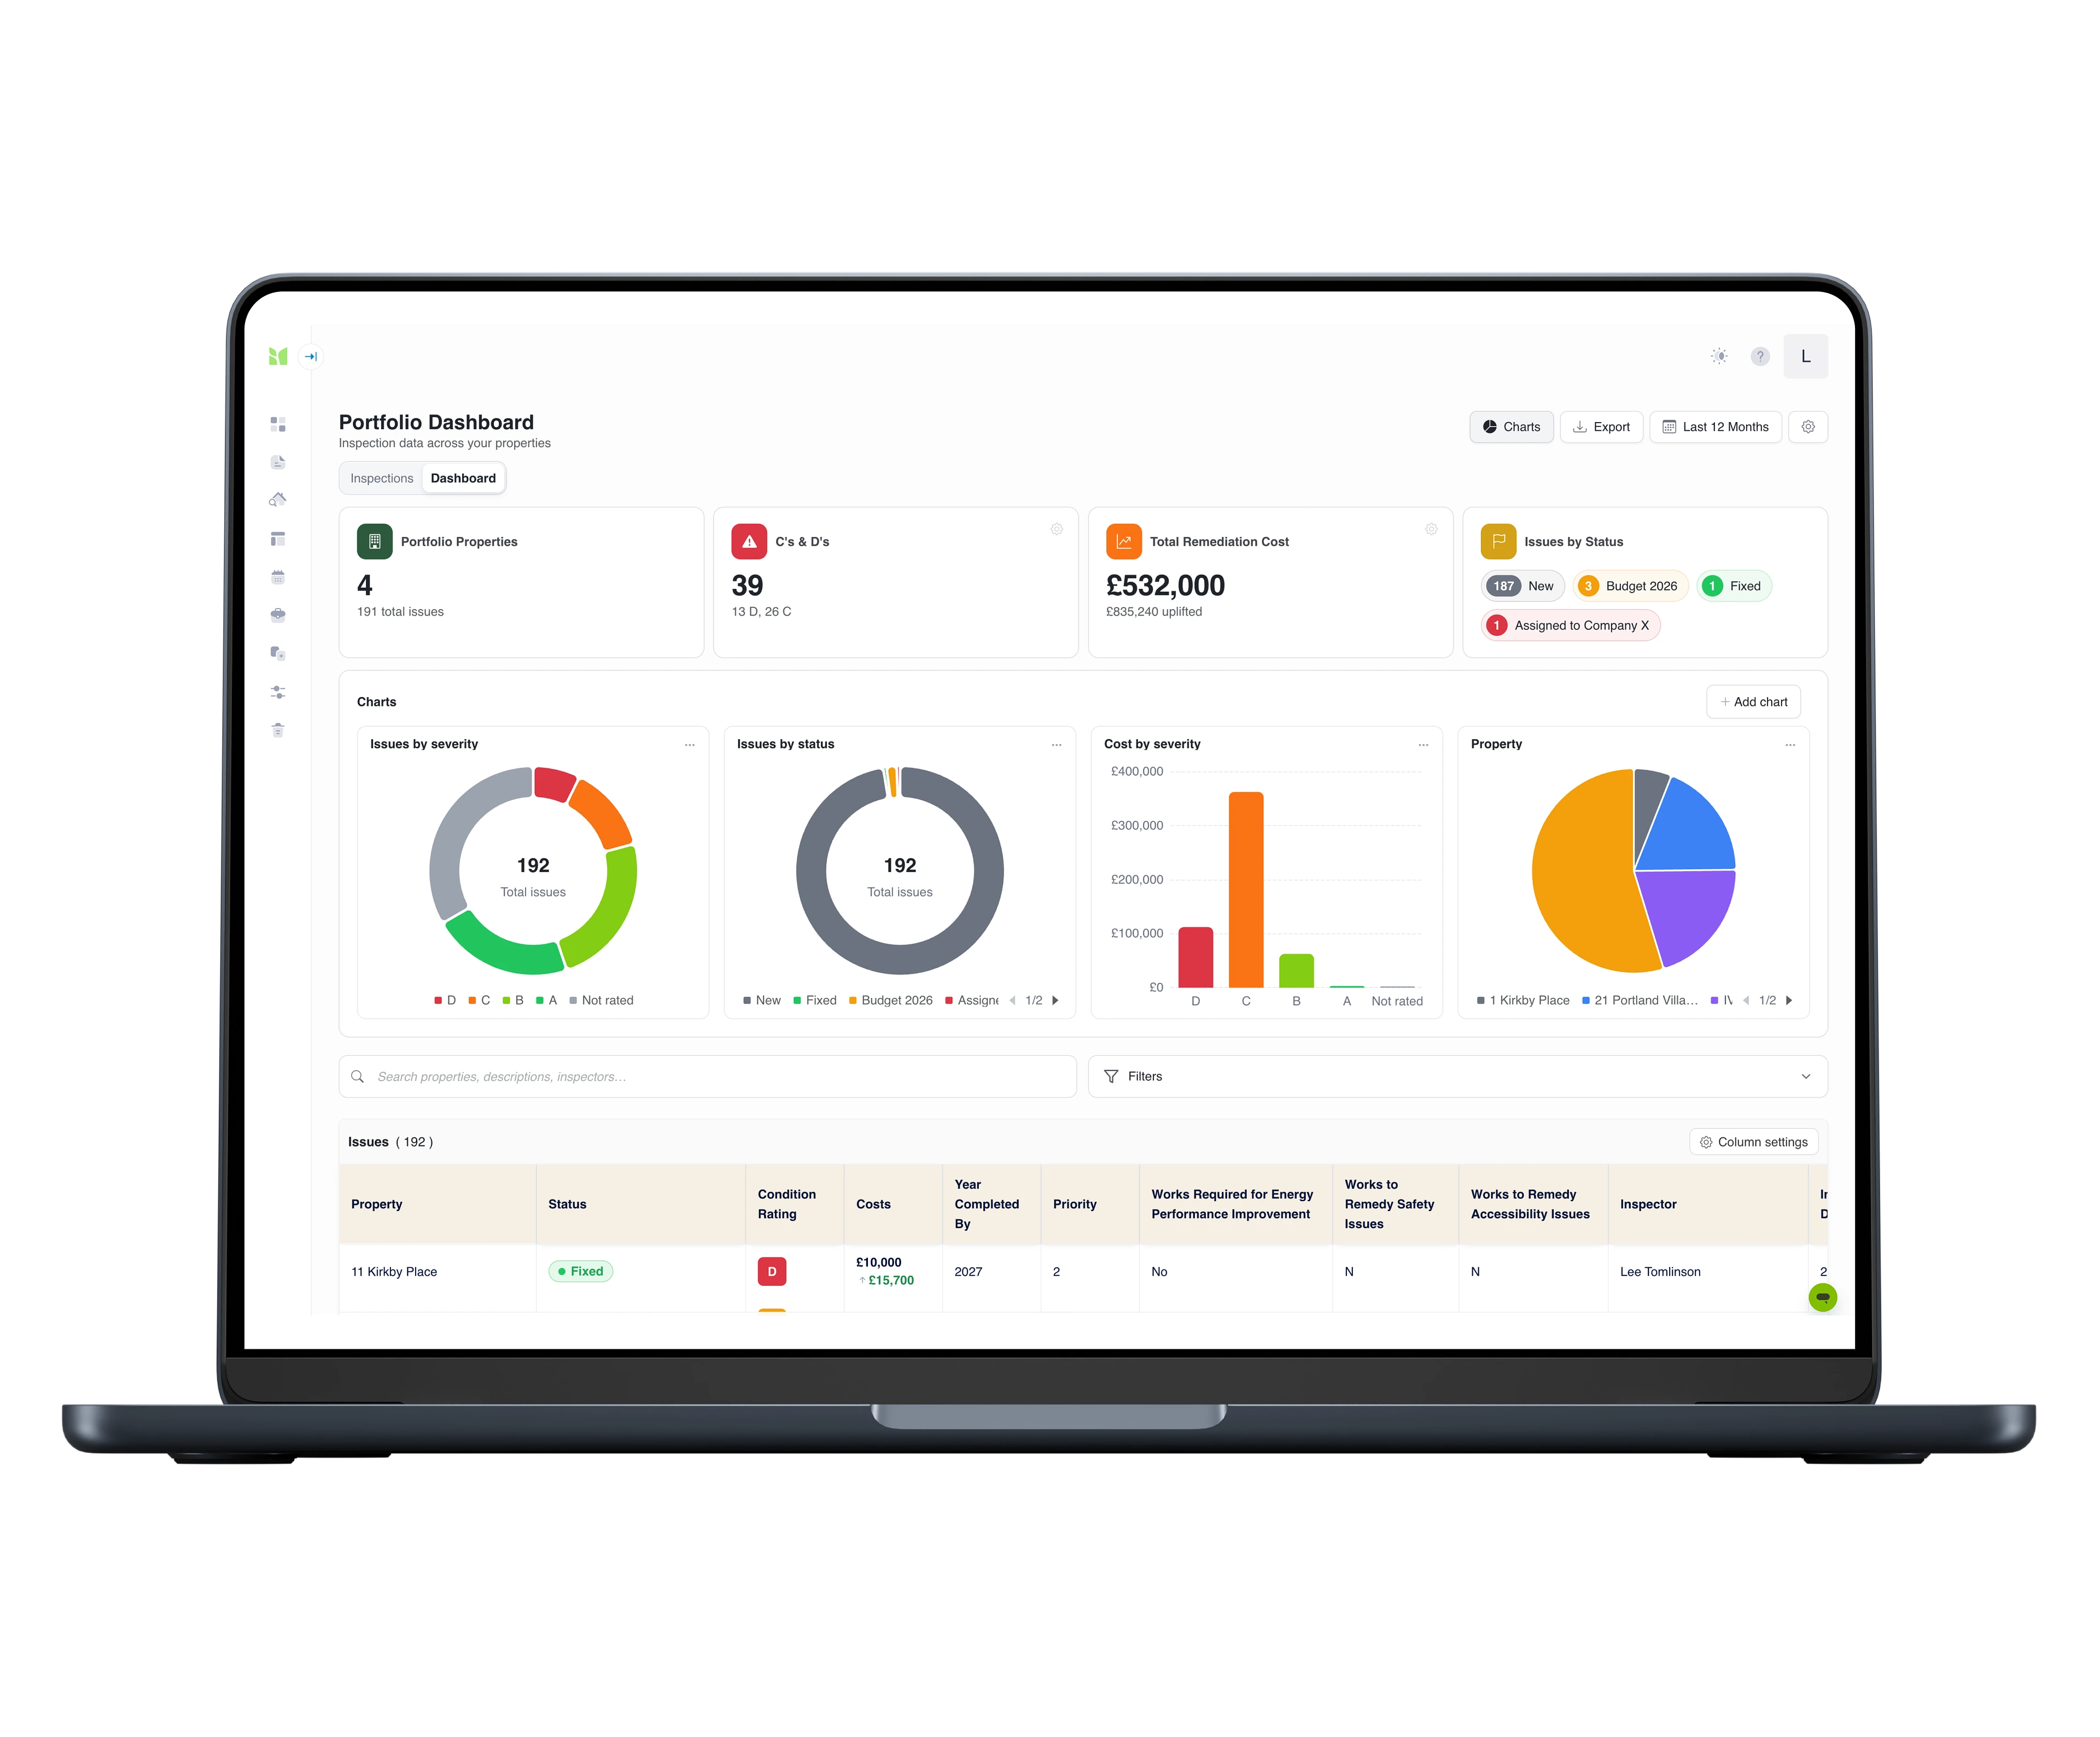
The condition side of asset management, done properly: your teams capture defects building by building, and the portfolio dashboard turns them into one live grid - severity A to D, remediation costs, statuses and a full history - so maintenance is planned on evidence and the file is ready the moment a board or auditor asks.

Step one - in the field

Capture the condition of every building, offline

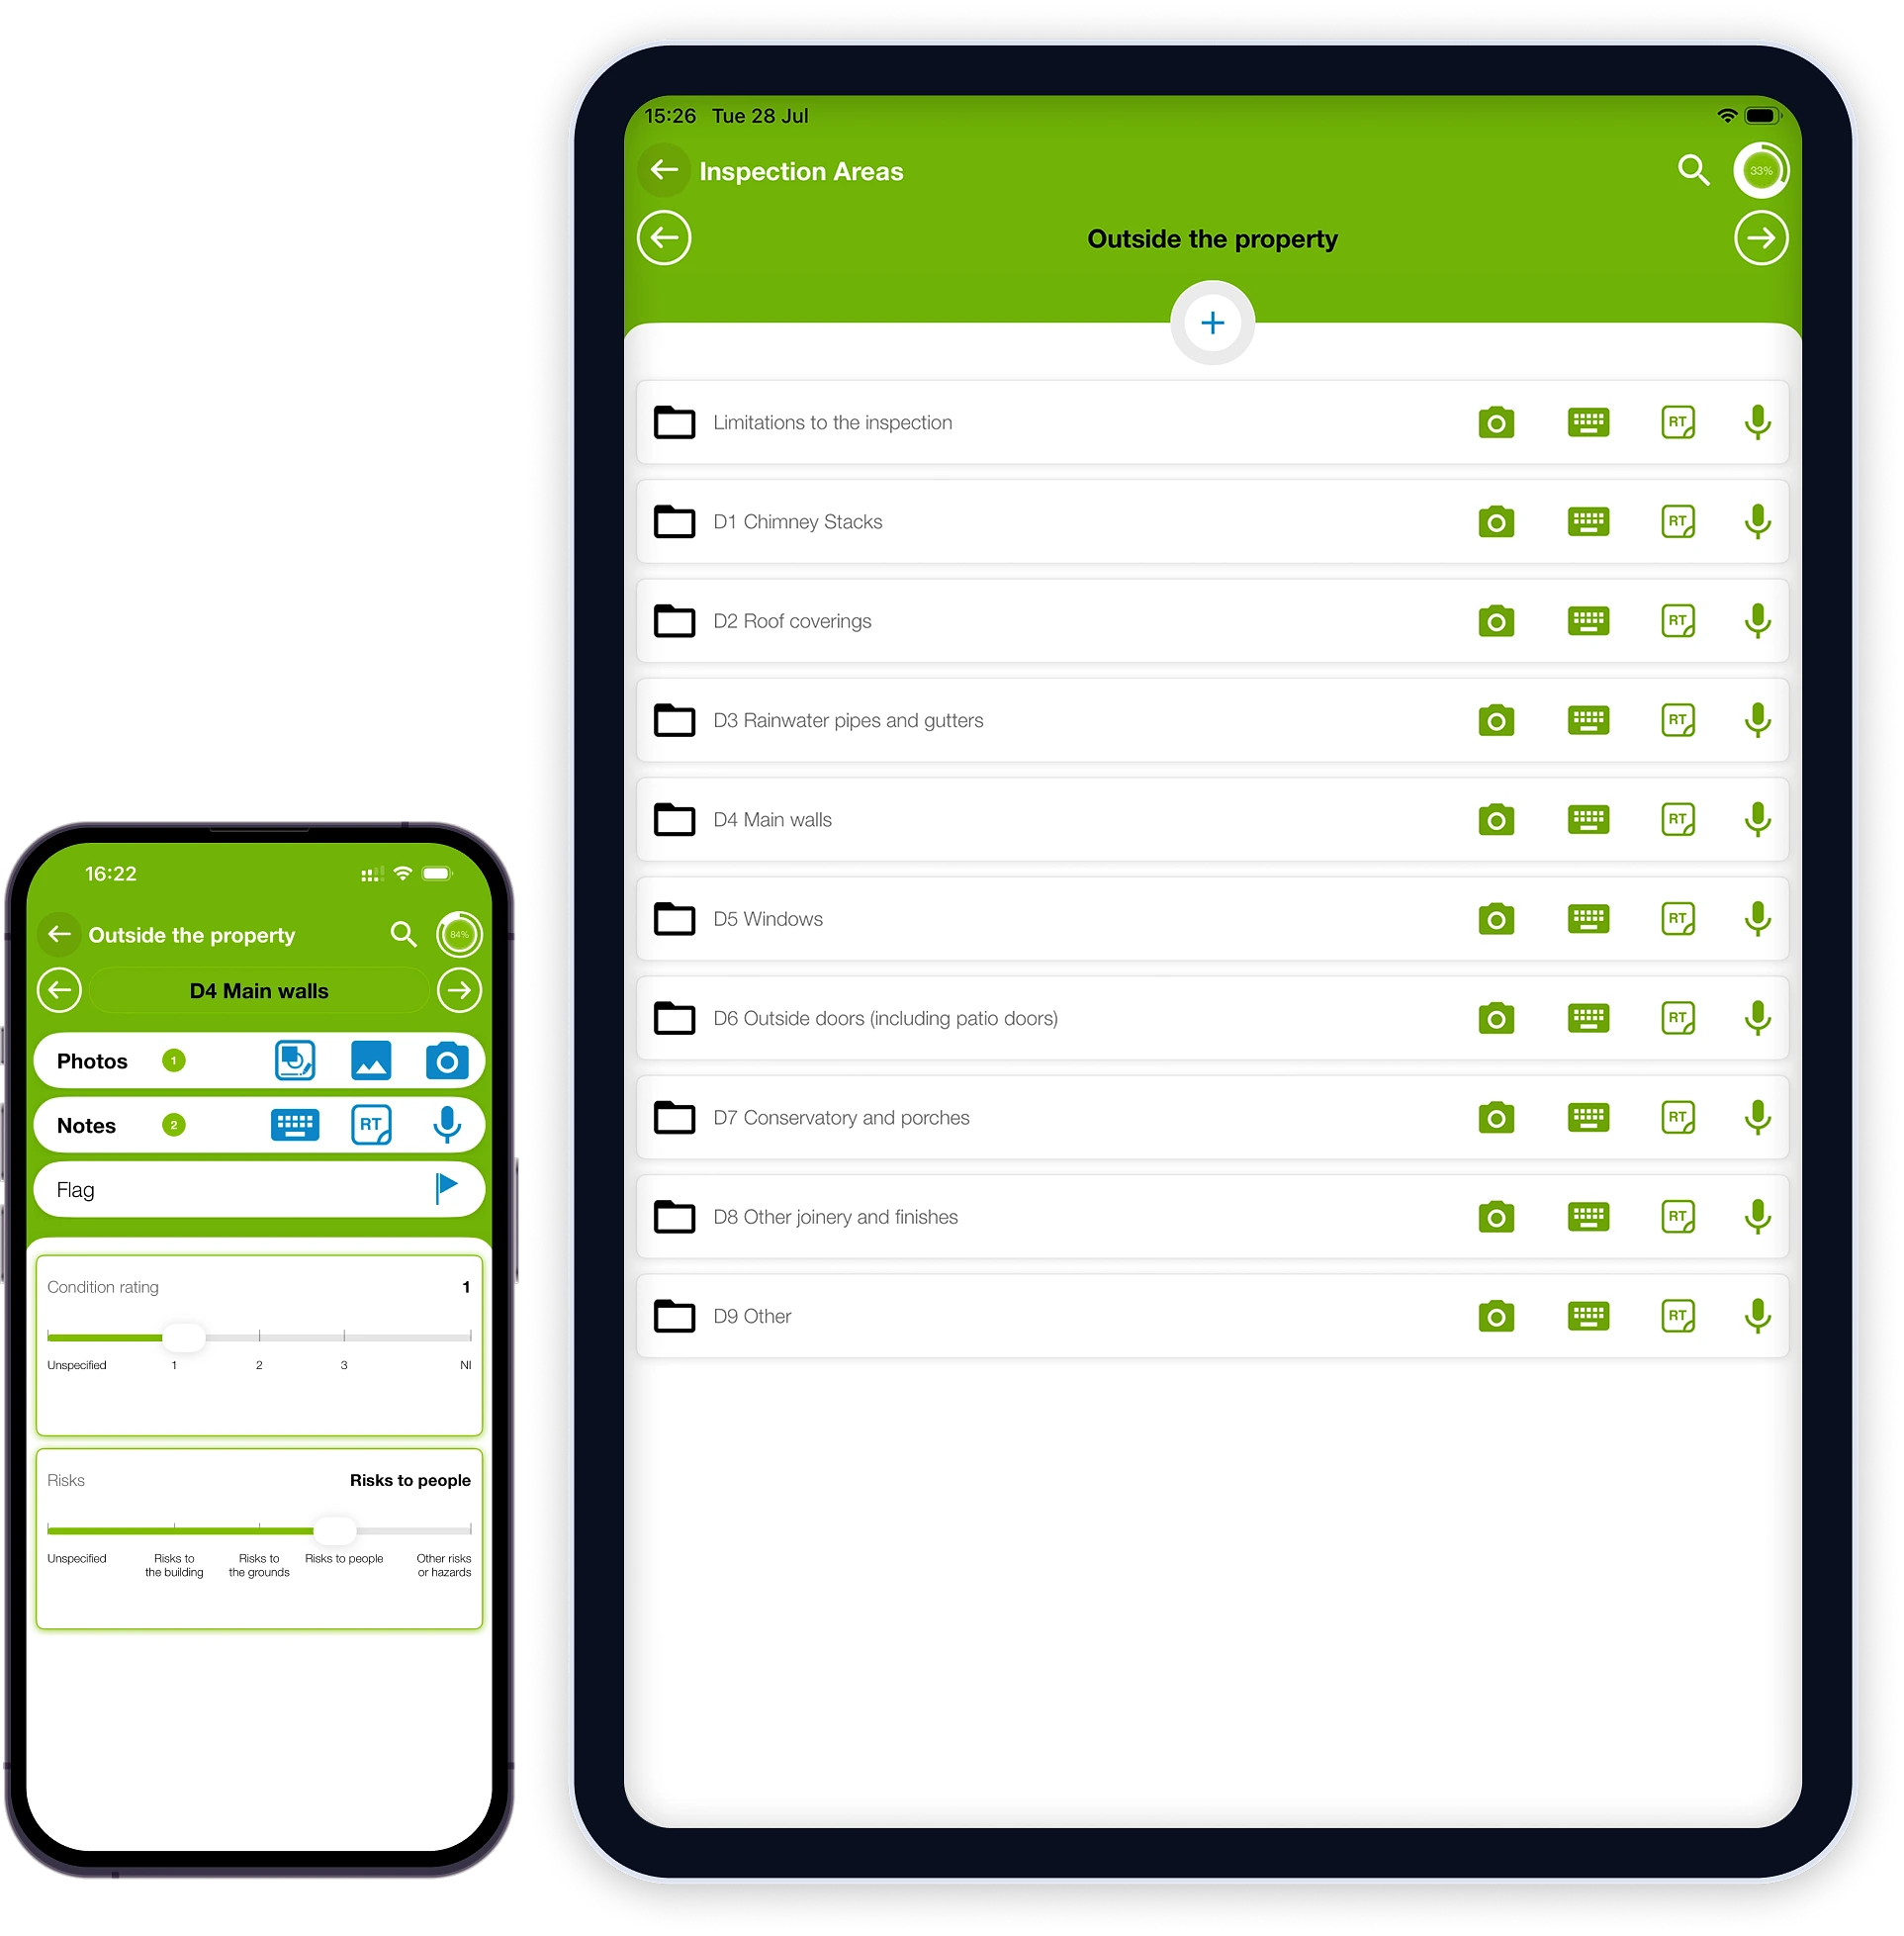
Your team walks each building with the Imfuna Surveyor app on a phone or tablet, recording what they find room by room. Sync the templates before setting out; after that no signal is needed, and the day's work uploads when they are back in coverage.

  • Condition A to D and priority 1 to 4 per defect - the grading your estate already uses
  • Element and sub-element, costs, notes and multiple photos per line item, GPS and time-stamped
  • Voice dictation that comes back as text against the item it describes
  • Flags for safety, accessibility, sustainability and energy performance
Capture the condition of every building, offline

Step two - back at the desk

Review, correct and issue professional reports

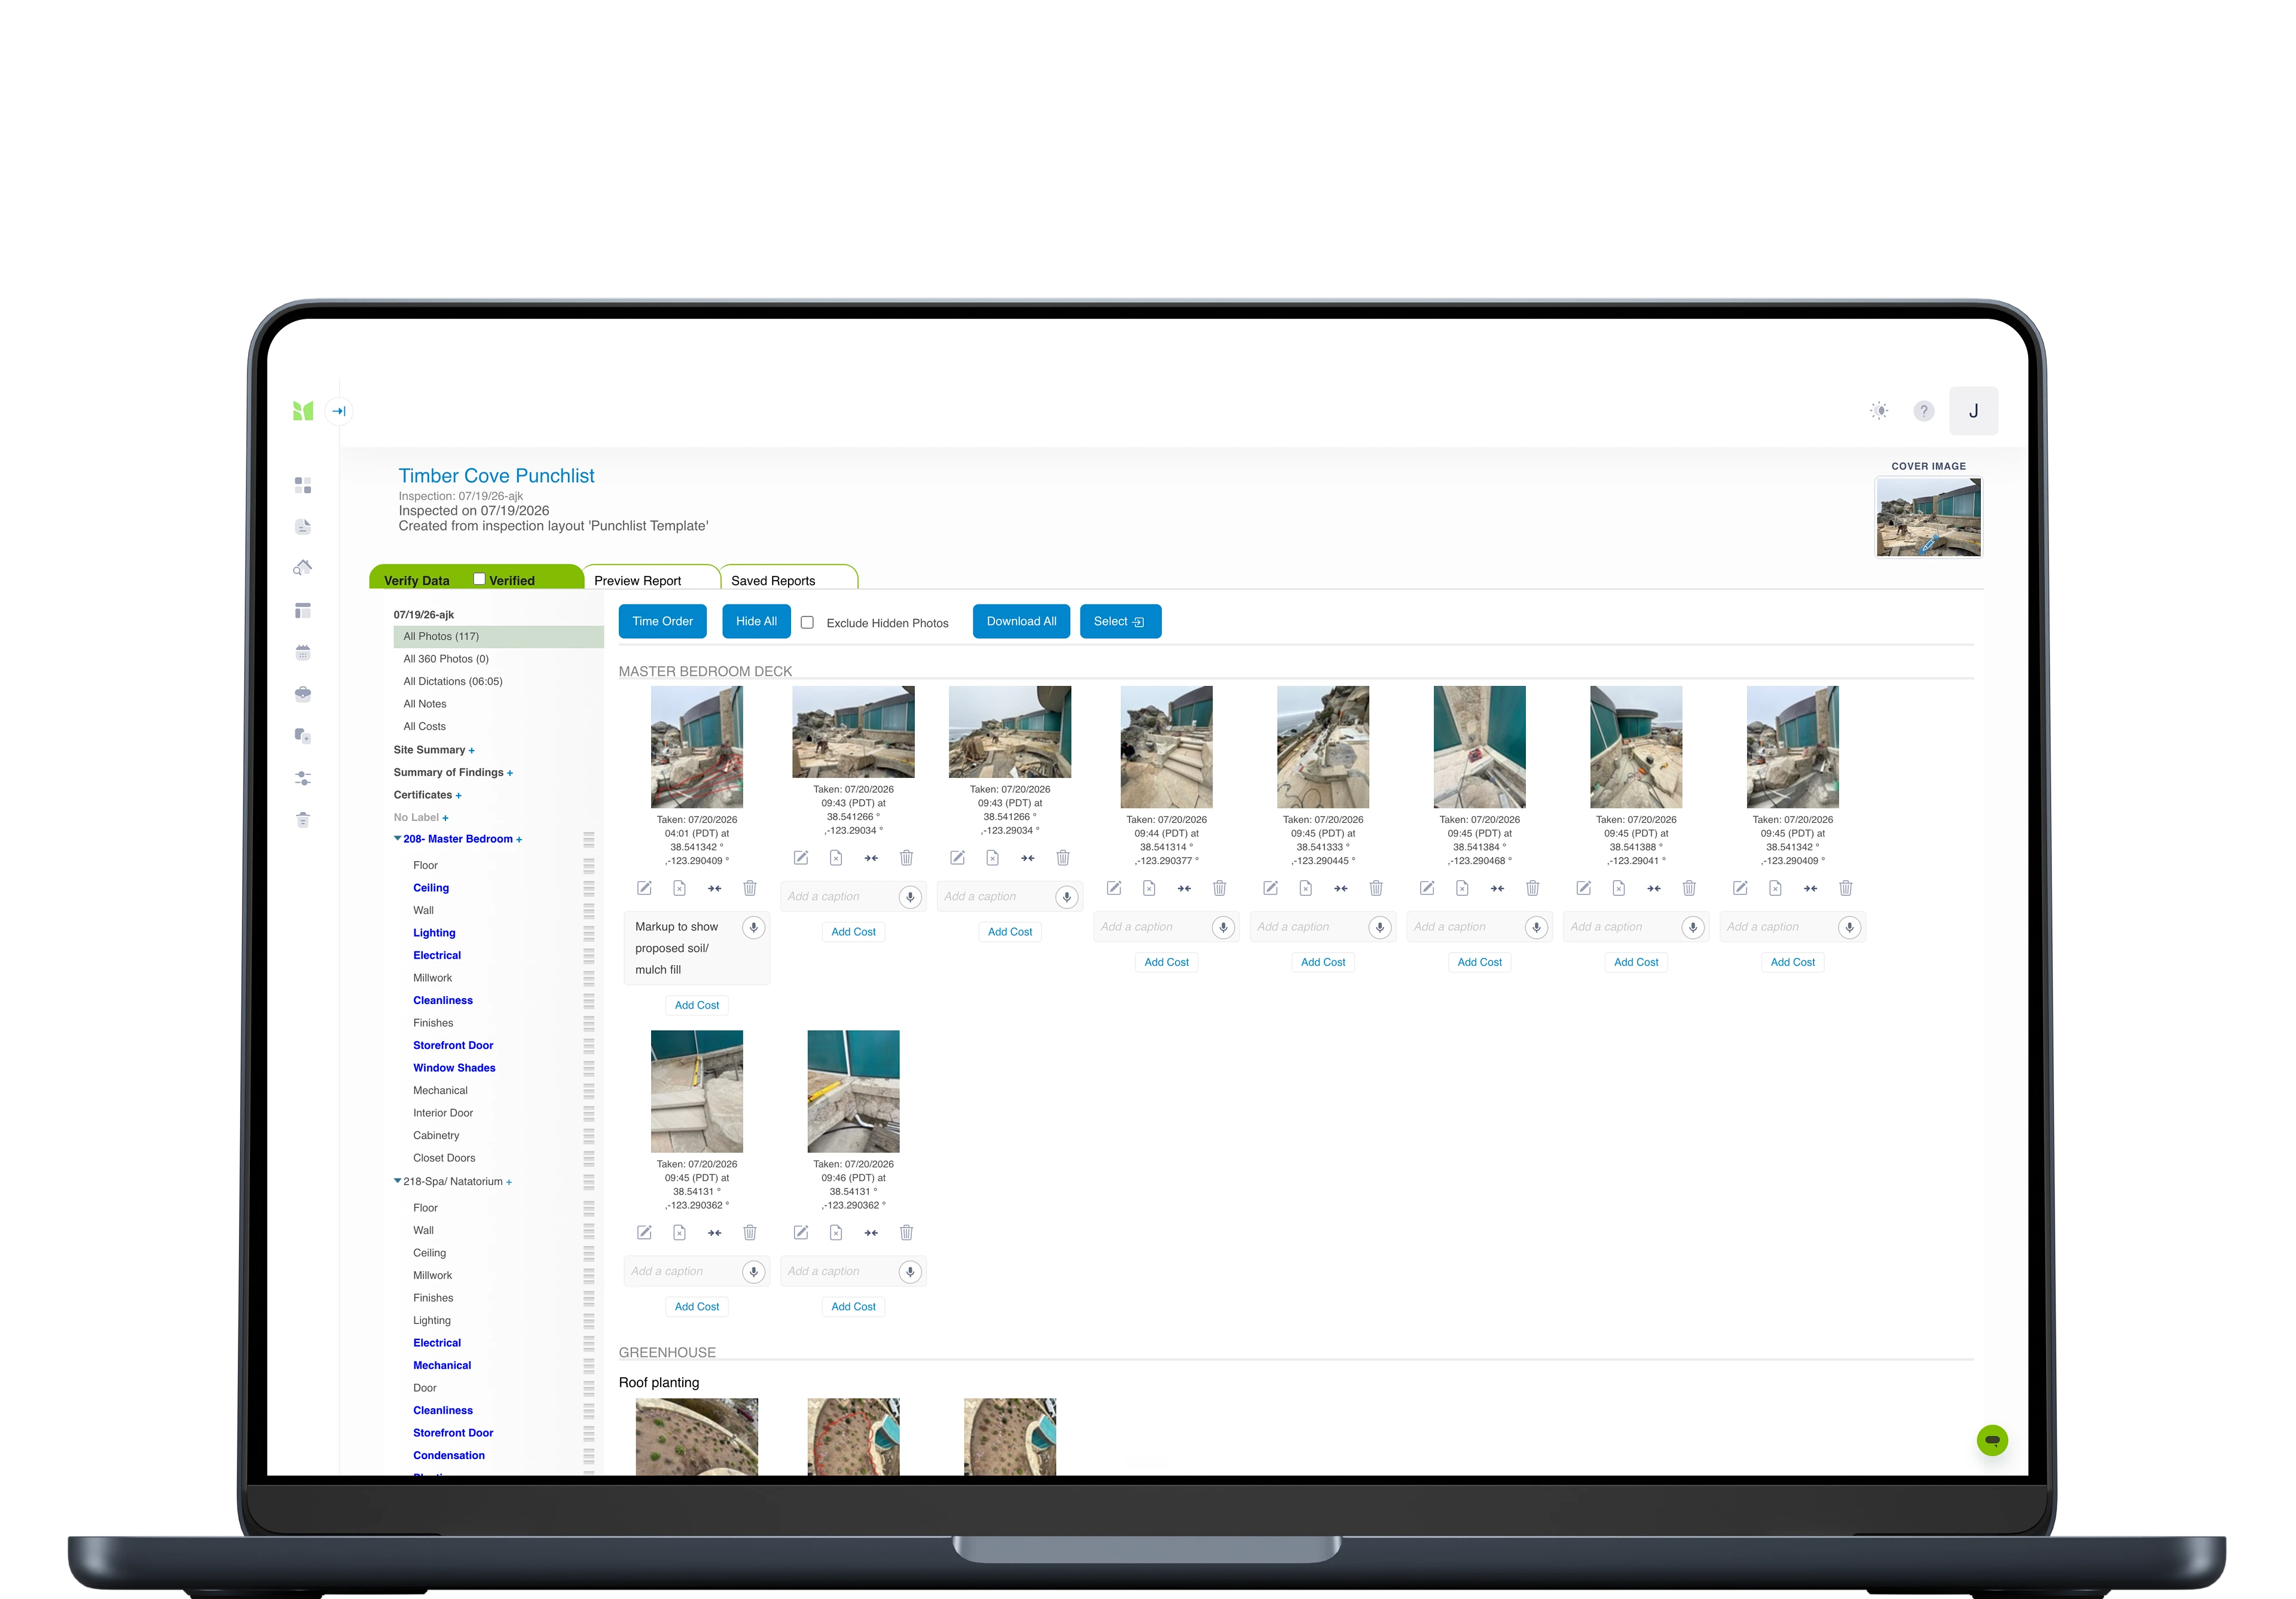
Everything captured on site is editable on the web - ratings, notes, costs, photos - without revisiting the building. Issue branded, immutable survey reports per building: a re-render is byte-identical, so what you signed is what stays on file.

  • Web editing and browser photo markup - a new contractor quote updates totals in seconds
  • Branded PDF reports with your logo, layout and cover page
  • Reports frozen on generation, originals kept for seven years
Review, correct and issue professional reports

Step three - across the portfolio

One live dashboard for every issue in the estate

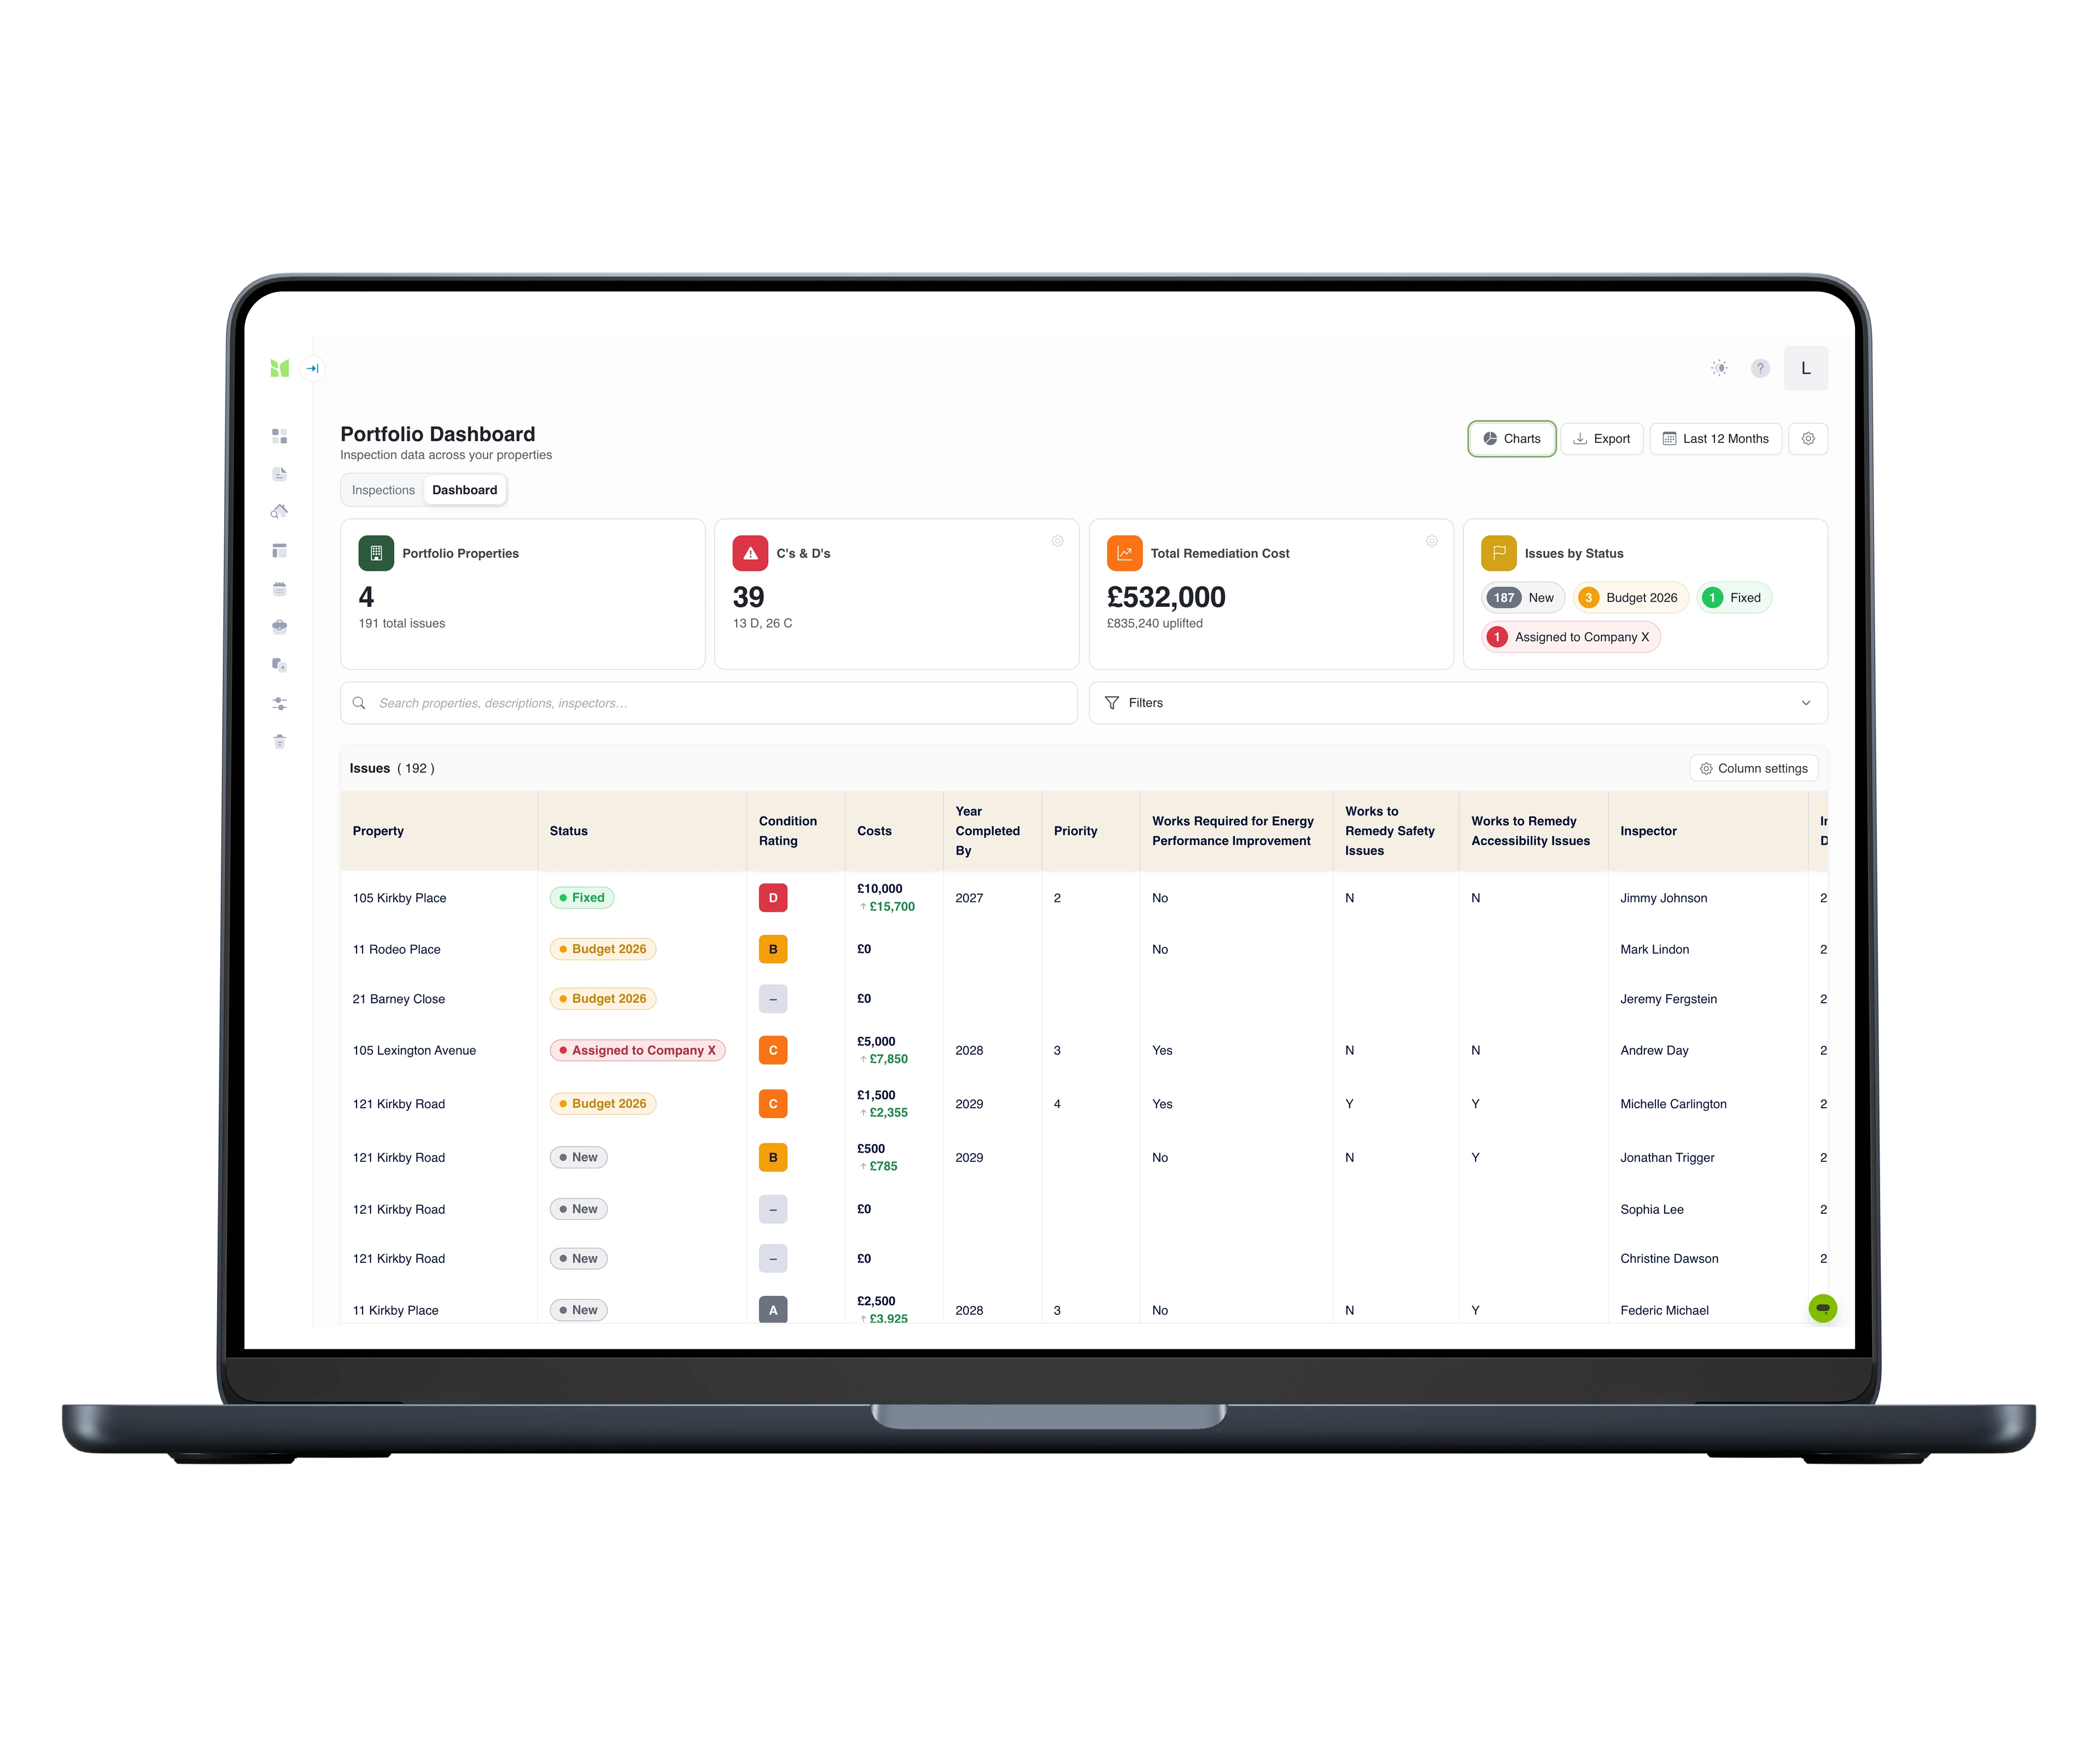
Each defect becomes a row in the portfolio dashboard moments after upload. Filter to the Ds with safety flags, hold remediation costs against each issue, and move work through your own statuses - every change logged.

  • Filter by severity, priority, element, flag or year - like the spreadsheet your team knows, never a stale export
  • Remediation cost per issue, with a presentation-only uplift for prudent budgeting
  • Your own workflow statuses - new, assigned, in progress, fixed - with who changed what, when
  • History follows each issue across years of re-surveys - found one year, fixed the next, one timeline
One live dashboard for every issue in the estate

Step four - to the people with the budget

Charts on screen. Excel for the data. A PDF for the board.

When the estate's picture has assembled itself, put it in front of the people who allocate the money - in whichever format the room expects.

  • KPI tiles: properties, high-priority issues, total remediation cost with configurable uplift
  • Charts by severity, status, cost, priority or year - count or £ at a click
  • Excel of exactly the current view, with evidence links and the status history as a second sheet
  • A branded PDF portfolio report generated from any filtered view
Charts on screen. Excel for the data. A PDF for the board.

What the platform does for you

Severity A–D, priority 1–4

Grade every defect the way estates teams already think, and filter the whole portfolio by it.

Remediation cost tracking

A cost against every issue, a presentation-only uplift for prudent budgeting, and totals that update as quotes land.

Statuses with an audit trail

Your own workflow - new, assigned, in progress, fixed - with who changed what, when, on every issue.

Charts on demand

Issues by severity, status, cost, priority, year completed or any flag you capture - switch between count and £.

Excel that carries evidence

Export exactly the filtered view; every row deep-links to its photos, and the status history ships as a second sheet.

The portfolio report

A branded PDF of any filtered view - KPI tiles, condition profile, workflow status and cost concentration by property.

Re-survey, not re-type

Next year, pick the building up with its structure carried over and edit only what changed. Histories persist.

Access per person

Field teams capture; managers see the dashboard. Everyone works from one organisation-wide view.

Templates & workflows

Templates that feed the dashboard.

Each of these captures severity, priority and cost in a structure the portfolio dashboard understands - so the estate's picture assembles itself as your teams work.

Every template is fully customisable - structure, wording, branding - and your reports carry your identity, not ours.

Under 10 min
first-time dashboard setup - two questions, columns generated automatically
Seconds
from a field correction to the dashboard updating
1 grid
every issue across the estate, each row deep-linked to its evidence
A–D · 1–4
the condition grades and priorities your estate already uses

Questions teams ask us

Who enters and corrects the data?
Your field team captures on a phone or tablet; anything can be corrected on the web platform afterwards - ratings, notes, costs, photos - without revisiting site. A new contractor quote updates the totals in seconds.
How current is the dashboard?
Live. Edits re-project in seconds and open dashboards refresh automatically. It is a view of the inspection data itself, not an export of it.
What does setup involve?
Two questions: which template, which records. Every field becomes a column automatically, severity and cost are detected, and historic inspections backfill in the background. First-time setup typically takes under ten minutes.
What happens when we re-survey?
Whenever the next survey comes - annually or on your own cycle - pick the building up with its structure carried over and edit only what changed. The dashboard always shows the latest completed inspection, while statuses and history follow each issue from survey to survey: found in one, fixed in the next, one timeline.
Who can see it?
Access is enabled per user. Field teams can be capture-only while managers work in the dashboard; the view is scoped to your organisation.
Does it connect to the systems we already run?
Where it counts. Flagged issues can be pushed to Fixflo for maintenance follow-up, and Imfuna connects with MRI Sales & Lettings and TAP to keep property data consistent across the workflow. For everything else there is the Excel export - the exact filtered view, with evidence links and the status history.

Your workflow, end to end

Imfuna sits in the middle of the tools you already run - bookings in, evidence captured, findings pushed on to the systems that act on them.

All integrations →
Fixflo logo

Fixflo

Repairs & maintenance

Publish an inspection and its flagged findings land in Fixflo as maintenance issues - photos, notes and inspection context attached, linked to the property, ready to assign. It works both ways: fetch a property with an open Fixflo issue, inspect it, and push the evidence back.


MRI Sales & Lettings logo

MRI Sales & Lettings

Estate & lettings agency software

Properties in MRI Sales & Lettings arrive in Imfuna ready to inspect - inventories, check-ins, check-outs and comparisons - and the completed report returns to the tenancy record.

TAP logo

TAP

Commercial building operations

TAP’s property records and stacking plans flow into Imfuna and set up the inspection; flagged items push back into TAP as issues and potential hazards, photos attached.

Excel export, for everything else

Output all inspection data to MS Excel for use in other software - so even tools we don’t talk to natively can work from Imfuna data.

One useful email a month.

Regulation changes, inspection practice, product updates - written for your line of work, not everyone's. No noise, unsubscribe any time.

See Imfuna on your own portfolio

A live demo takes 30 minutes and uses your workflow, not ours.