
Imfuna · Bolt-on
Every defect, every building, one grid.
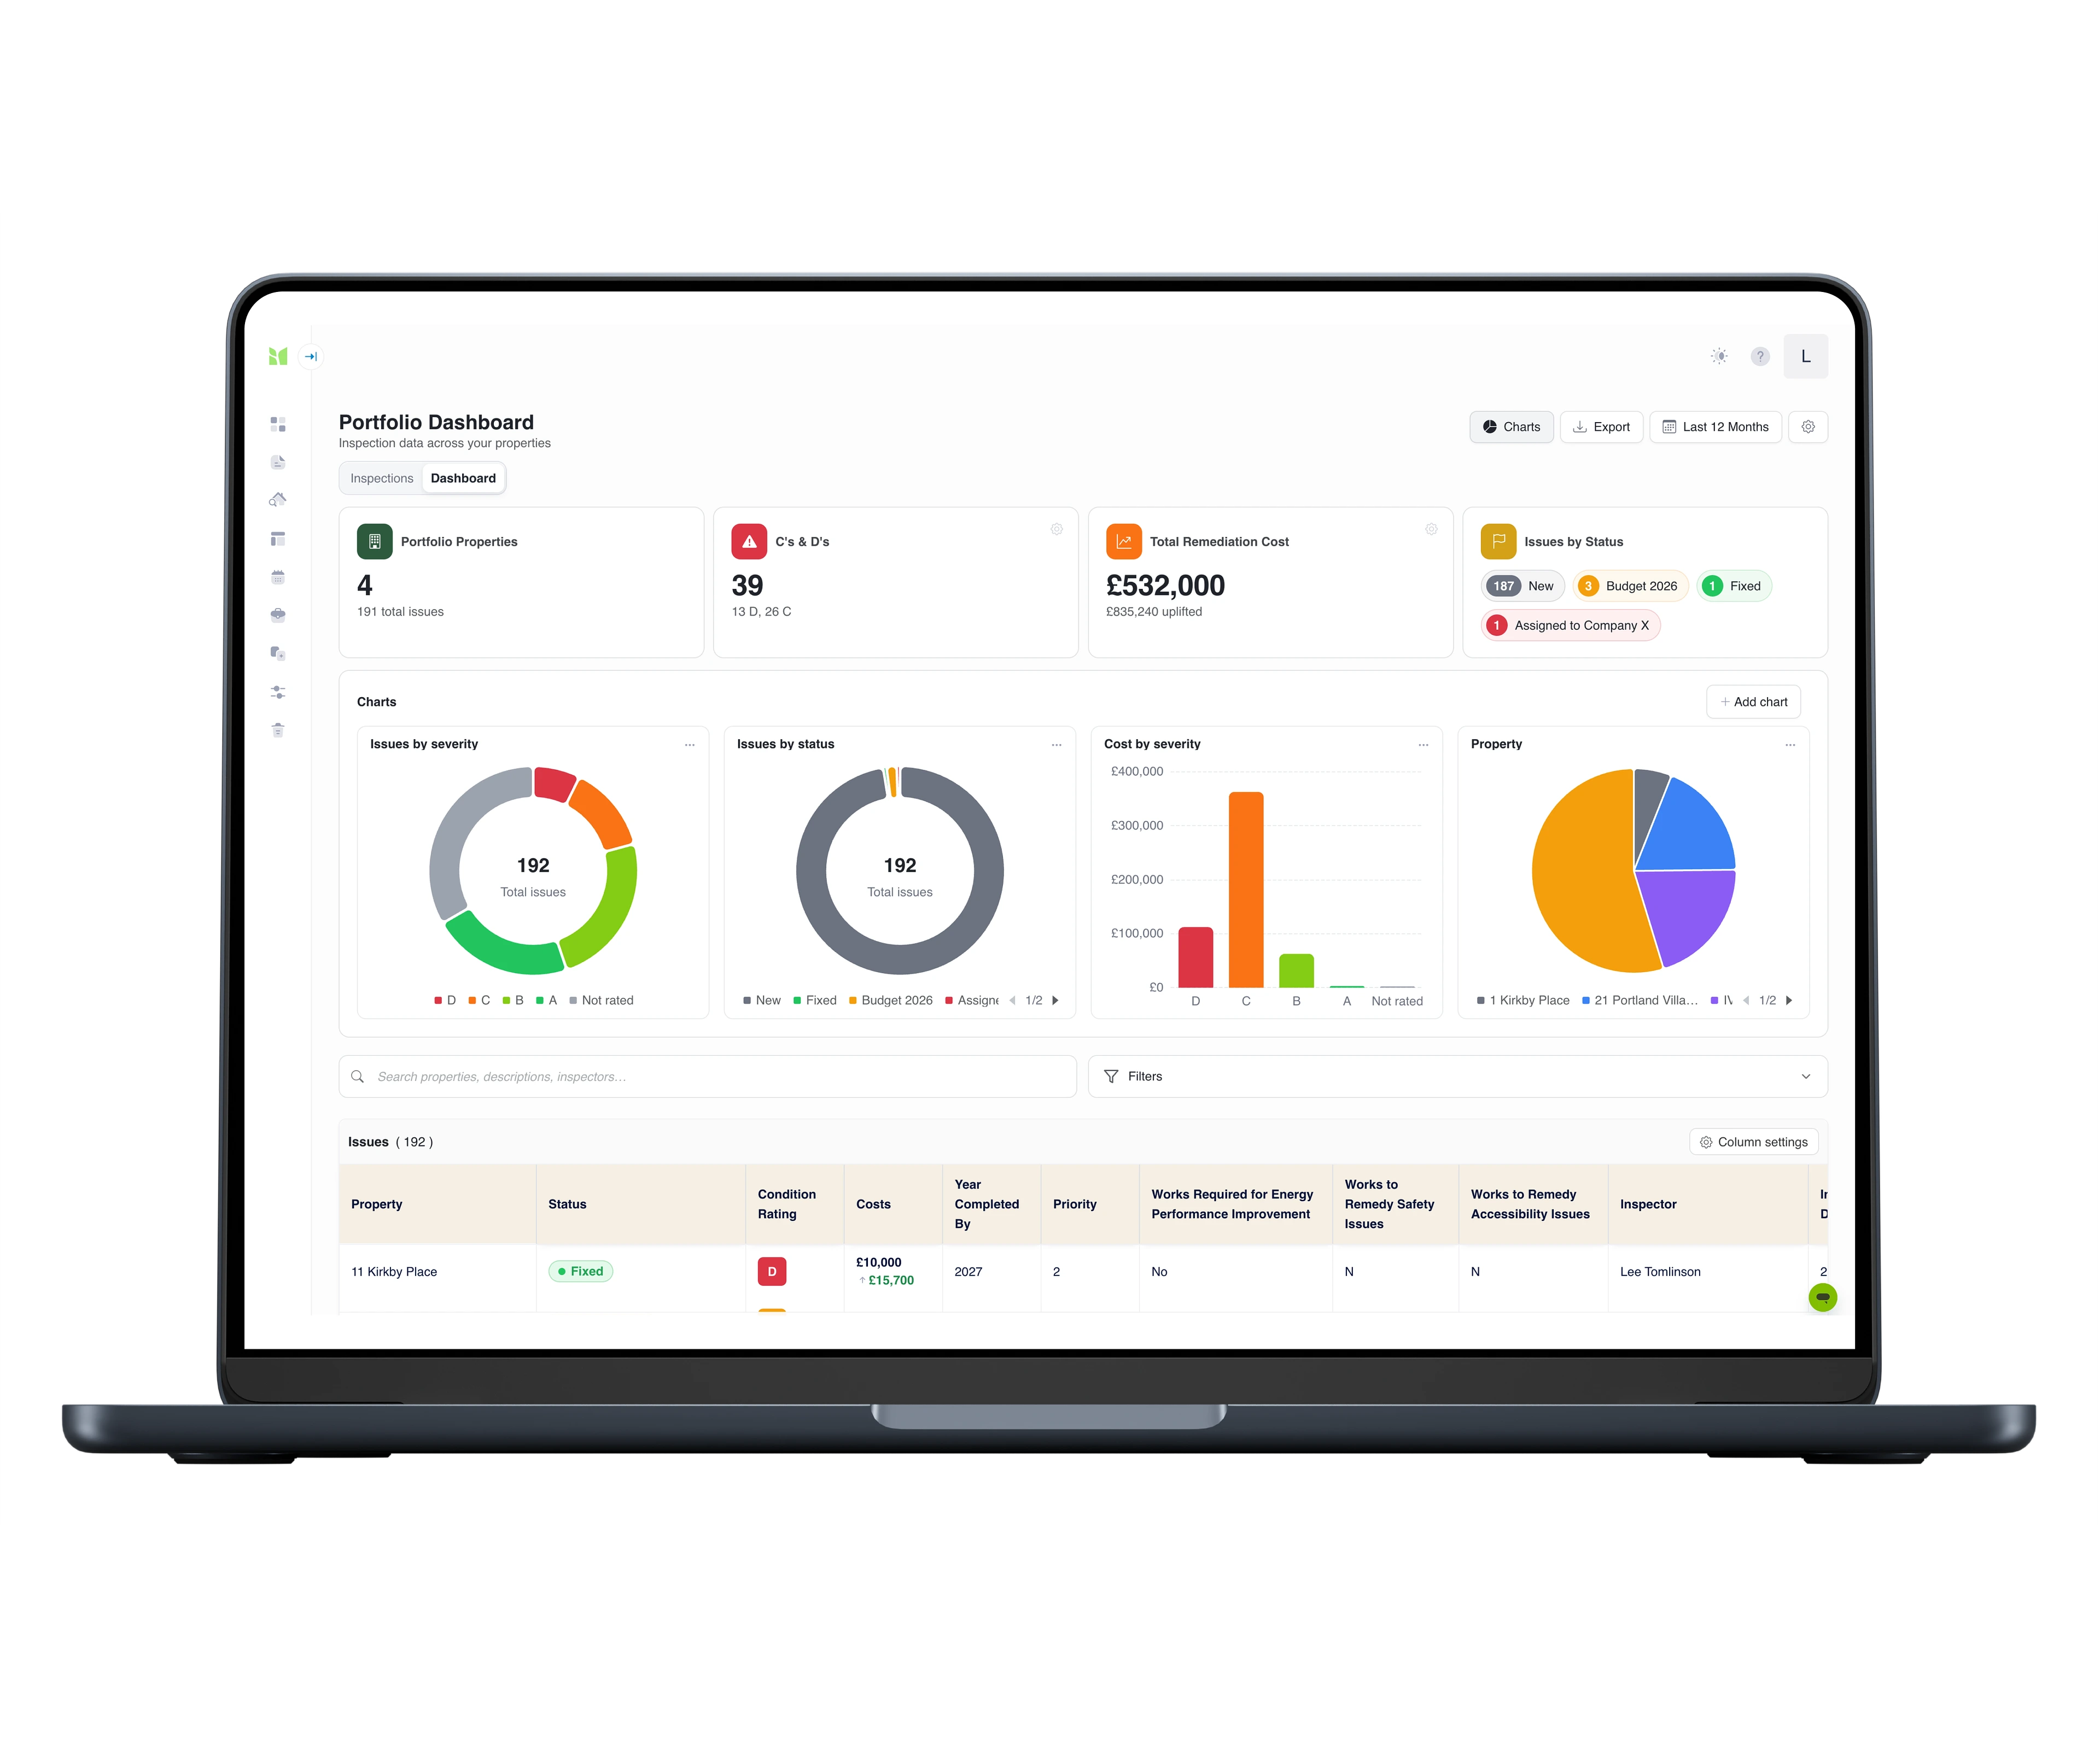
Portfolio work isn’t a stack of surveys - it’s a prioritisation problem. Every flagged issue from hundreds of surveys lands in one filterable table, so “which category D items go first, and what does the year cost?” takes a filter instead of a fortnight in Excel.
From £149/month per account · Included on Enterprise · First 30 days free
- Since 2009
- Building the property record
- 99.9%+
- Platform uptime, every year
- Cyber Essentials
- Certified
- RICS
- Tech Partner
Sound familiar?
This is what portfolio surveying looks like without it.
The consolidation
Every survey exported to Excel and merged by hand - again, this quarter.
The scatter
Category D items spread across forty reports, with no single ranked list.
The hunt
A client questions a line item, and you go digging through PDFs for the photo.
The stale workbook
The consolidated spreadsheet is out of date the moment a survey is revisited.
The options bill
The board asks for options, and every option costs a week in the workbook.
The disconnect
The budget in one file, the evidence in forty reports, and nothing joining them.
Centralise, triage, cost, decide
Every survey lands in one grid. Triage by grade, cost the programme, and put choices - not spreadsheets - in front of the board.
Triage
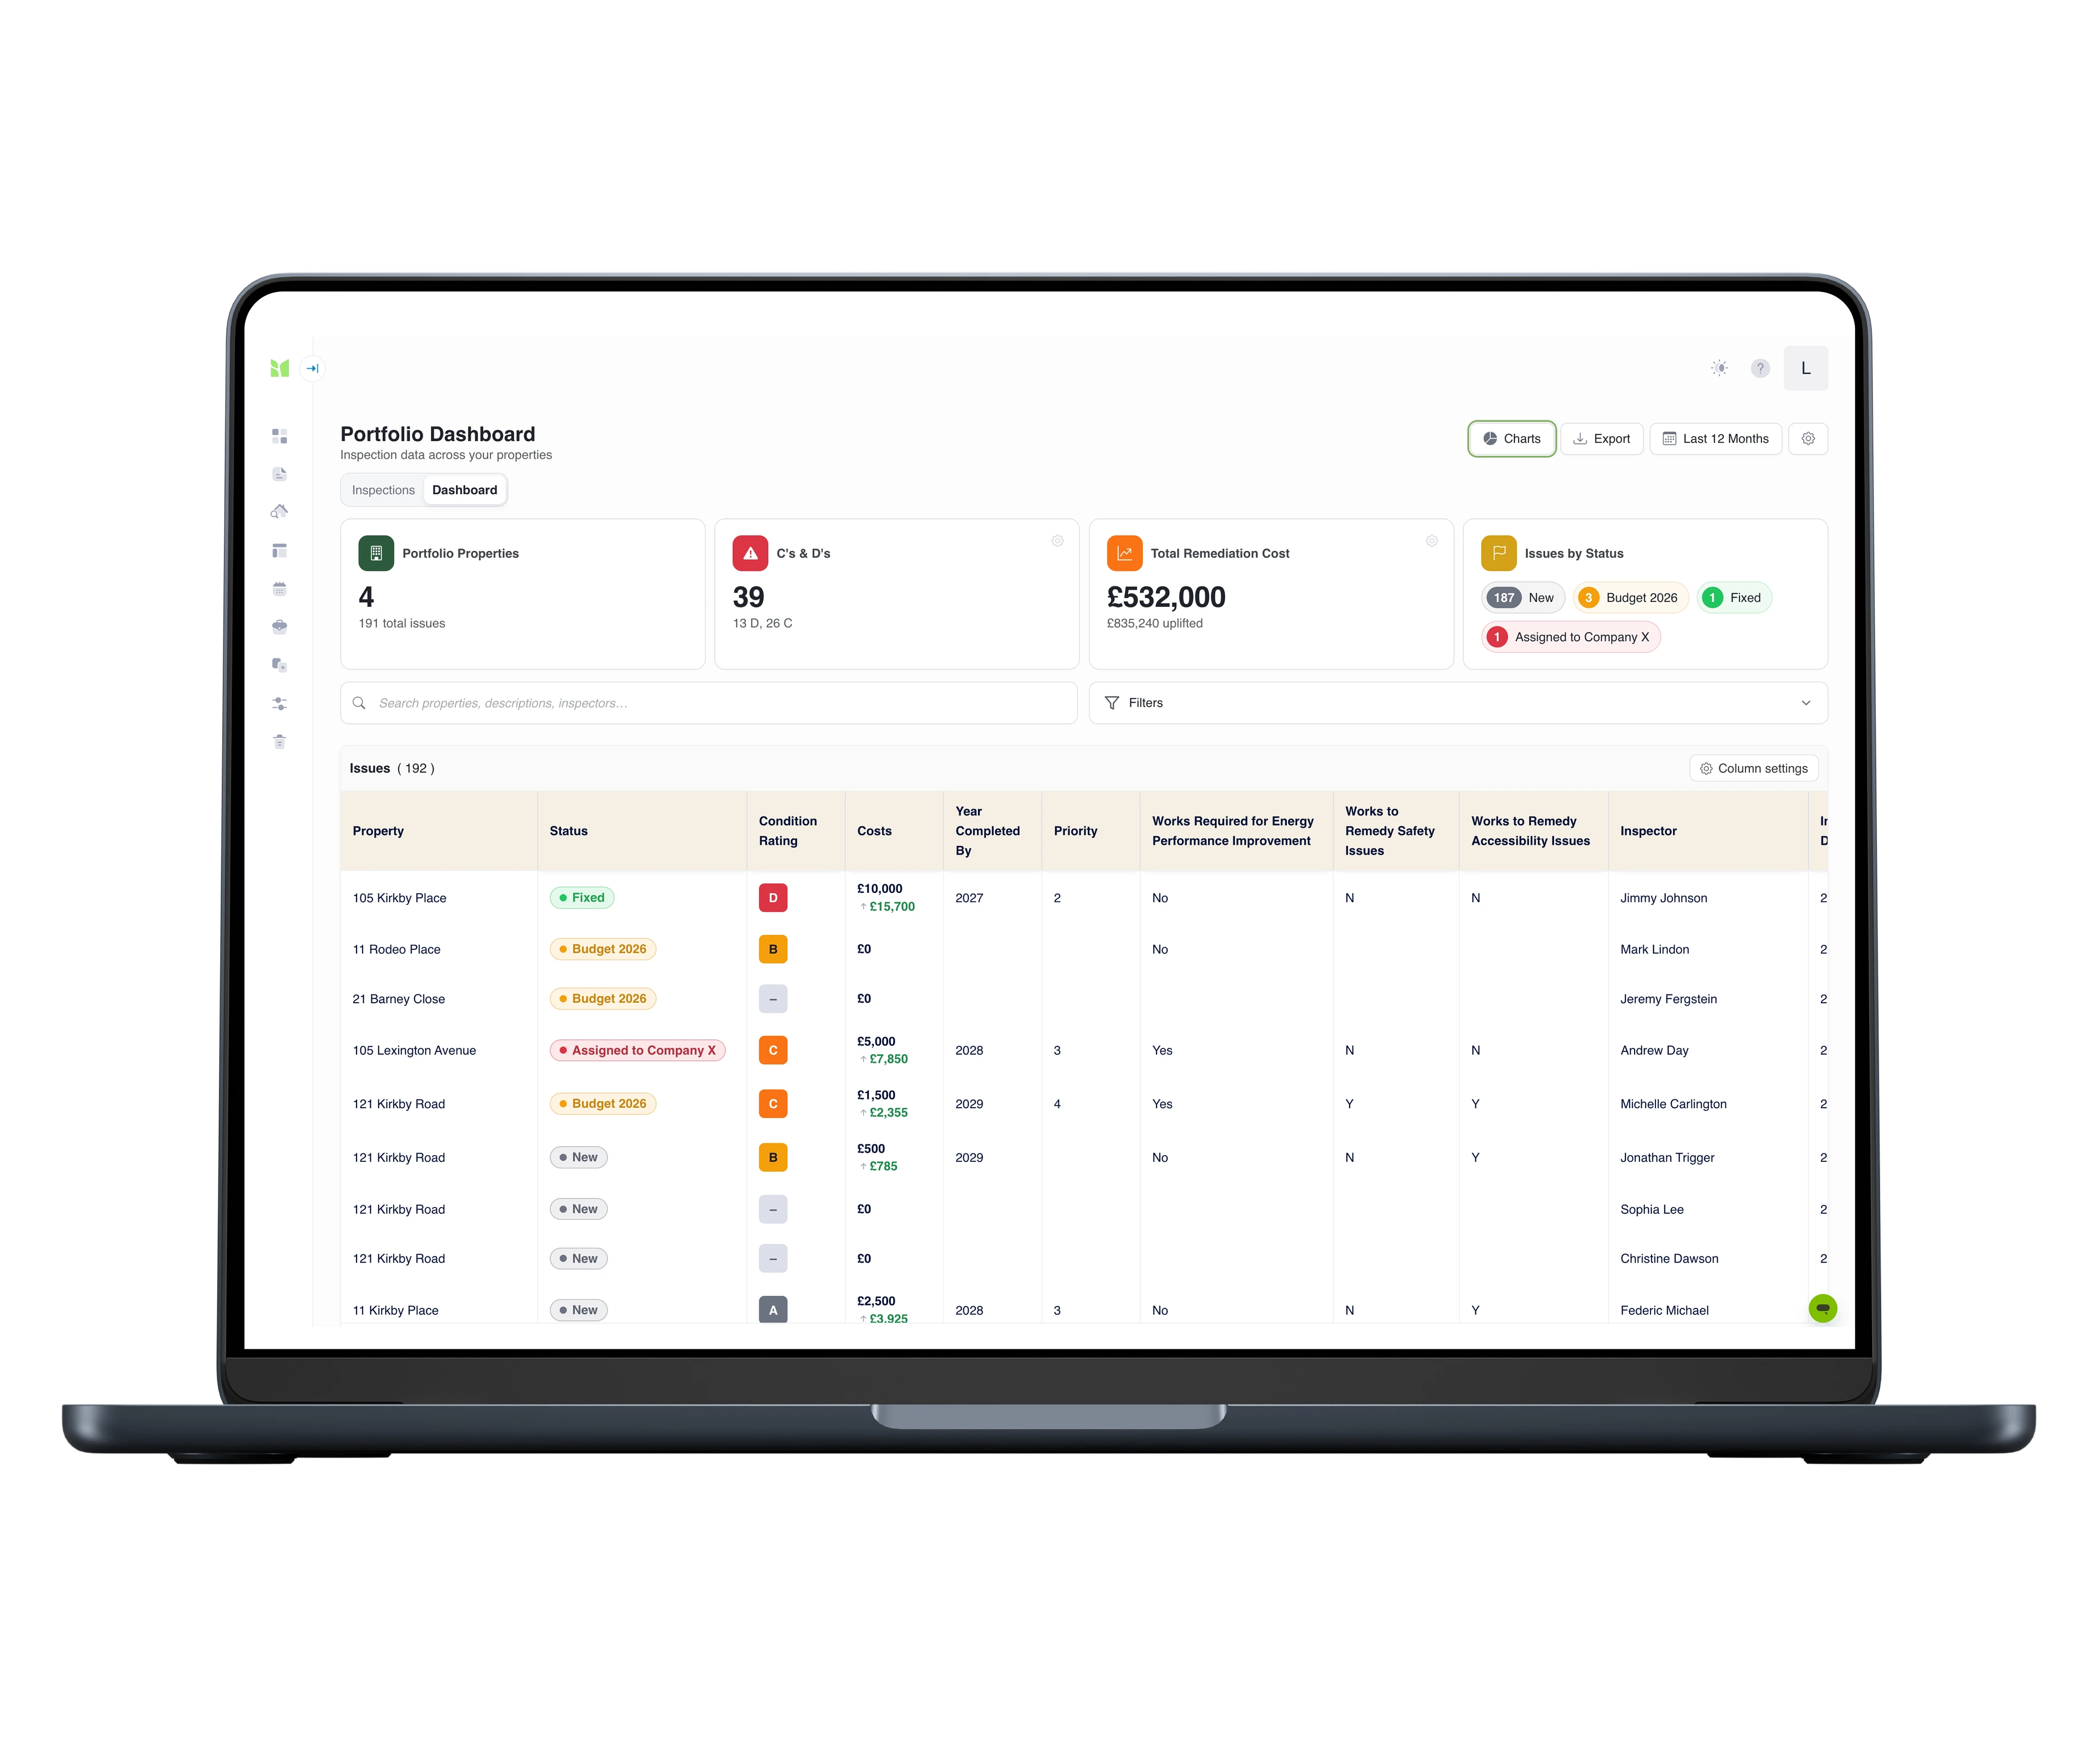
All the Ds with safety issues. There are 15. Start there.
The grid speaks your grade language - D, C, B, A, never someone else’s “critical/high/medium” - with the safety, accessibility and energy flags your prioritisation actually runs on. Filter D + safety works and you have the shortlist. Deal with those, then the rest of the Ds, then the Cs.
- The filtered count and cost total update live with every chip
Scenarios
Walk into the board meeting with three options
Every filter set is a costed scenario. Full compliance is one number. D and C only is a smaller one. Safety works this year is smaller still. Put the three side by side and the estate strategy conversation happens in the meeting - not in the fortnight before it.
- Each scenario exports to Excel with its filters, so stakeholders know exactly what they’re looking at
Budget
A £300k cut means these four buildings don’t get done
Set the agreed budget and the dashboard shows commitment against it - uplift included, because deferred work doesn’t stay at today’s prices. When the budget moves, the consequence is visible immediately: which buildings drop out, and what waiting costs.
Evidence
Two clicks to the photo
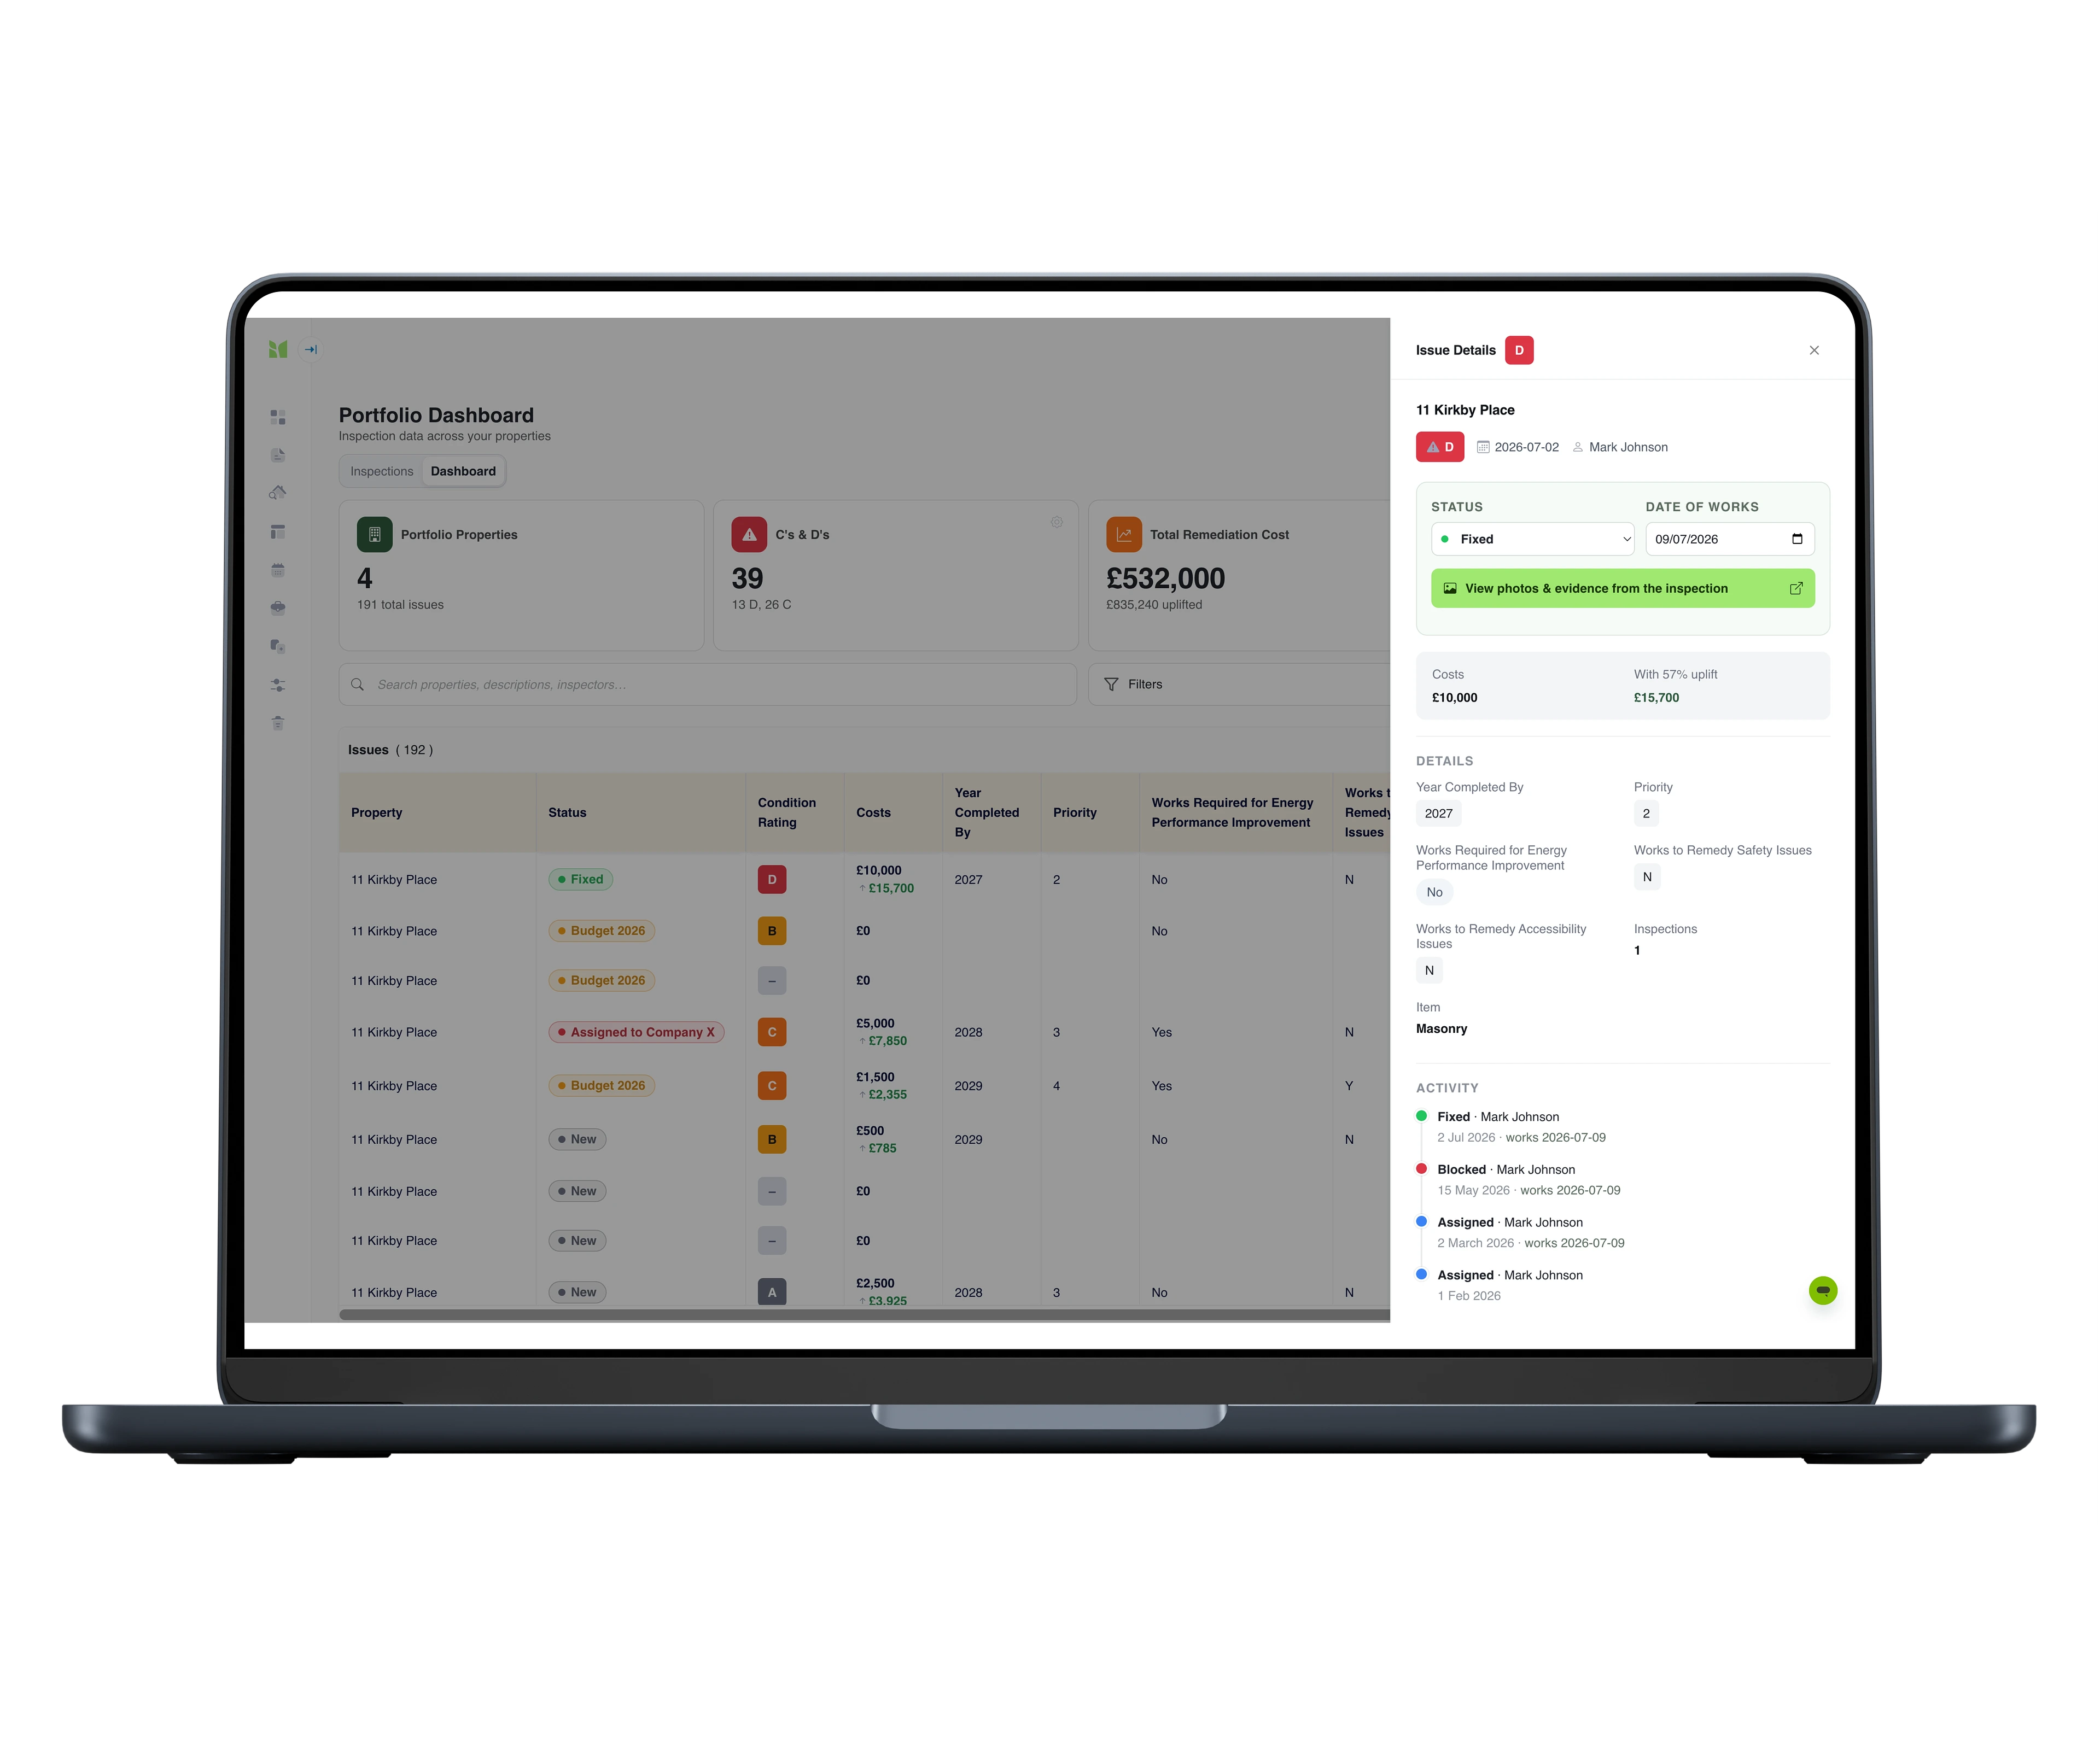
Every line knows what the issue is, where it sits, who captured it and when - and links straight into the survey section it came from, scrolled to the evidence. When a client pushes back on an item, the photo, the note and the context are right there.
Workflow
Fixed means fixed - and comes off the total
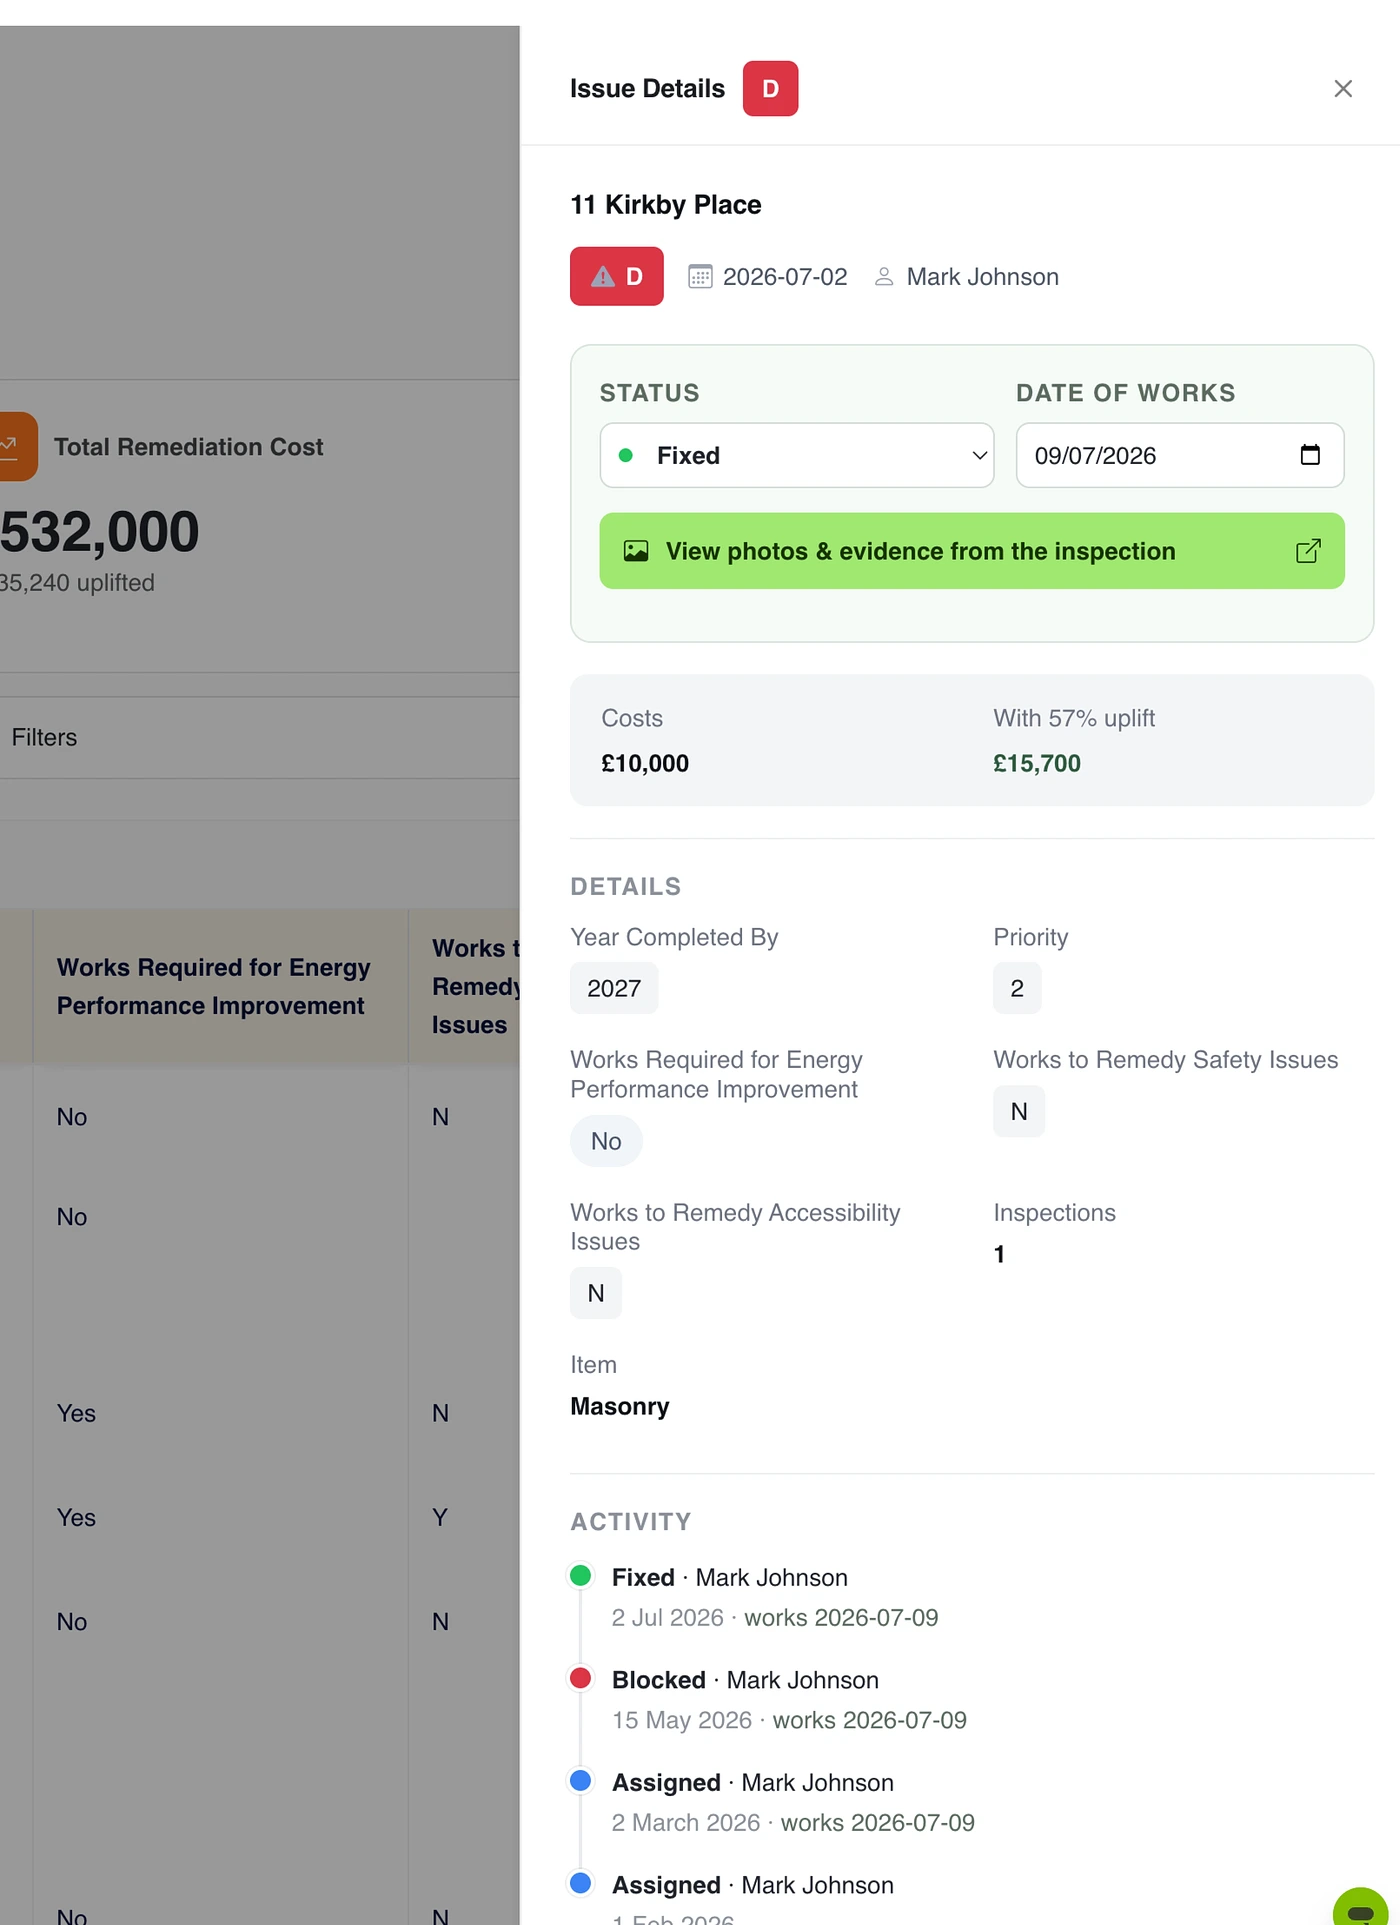
Issues carry statuses you define - new, quoted, in progress, blocked, fixed - plus a date of works and a cost you can update as quotes land; totals recalculate in seconds. Resolved issues leave the headline numbers, so the total is always the remaining programme, not history.
- Every status change and cost edit is logged - who, what, when - and travels with the export
Charts & exports
See the whole programme, not just the numbers
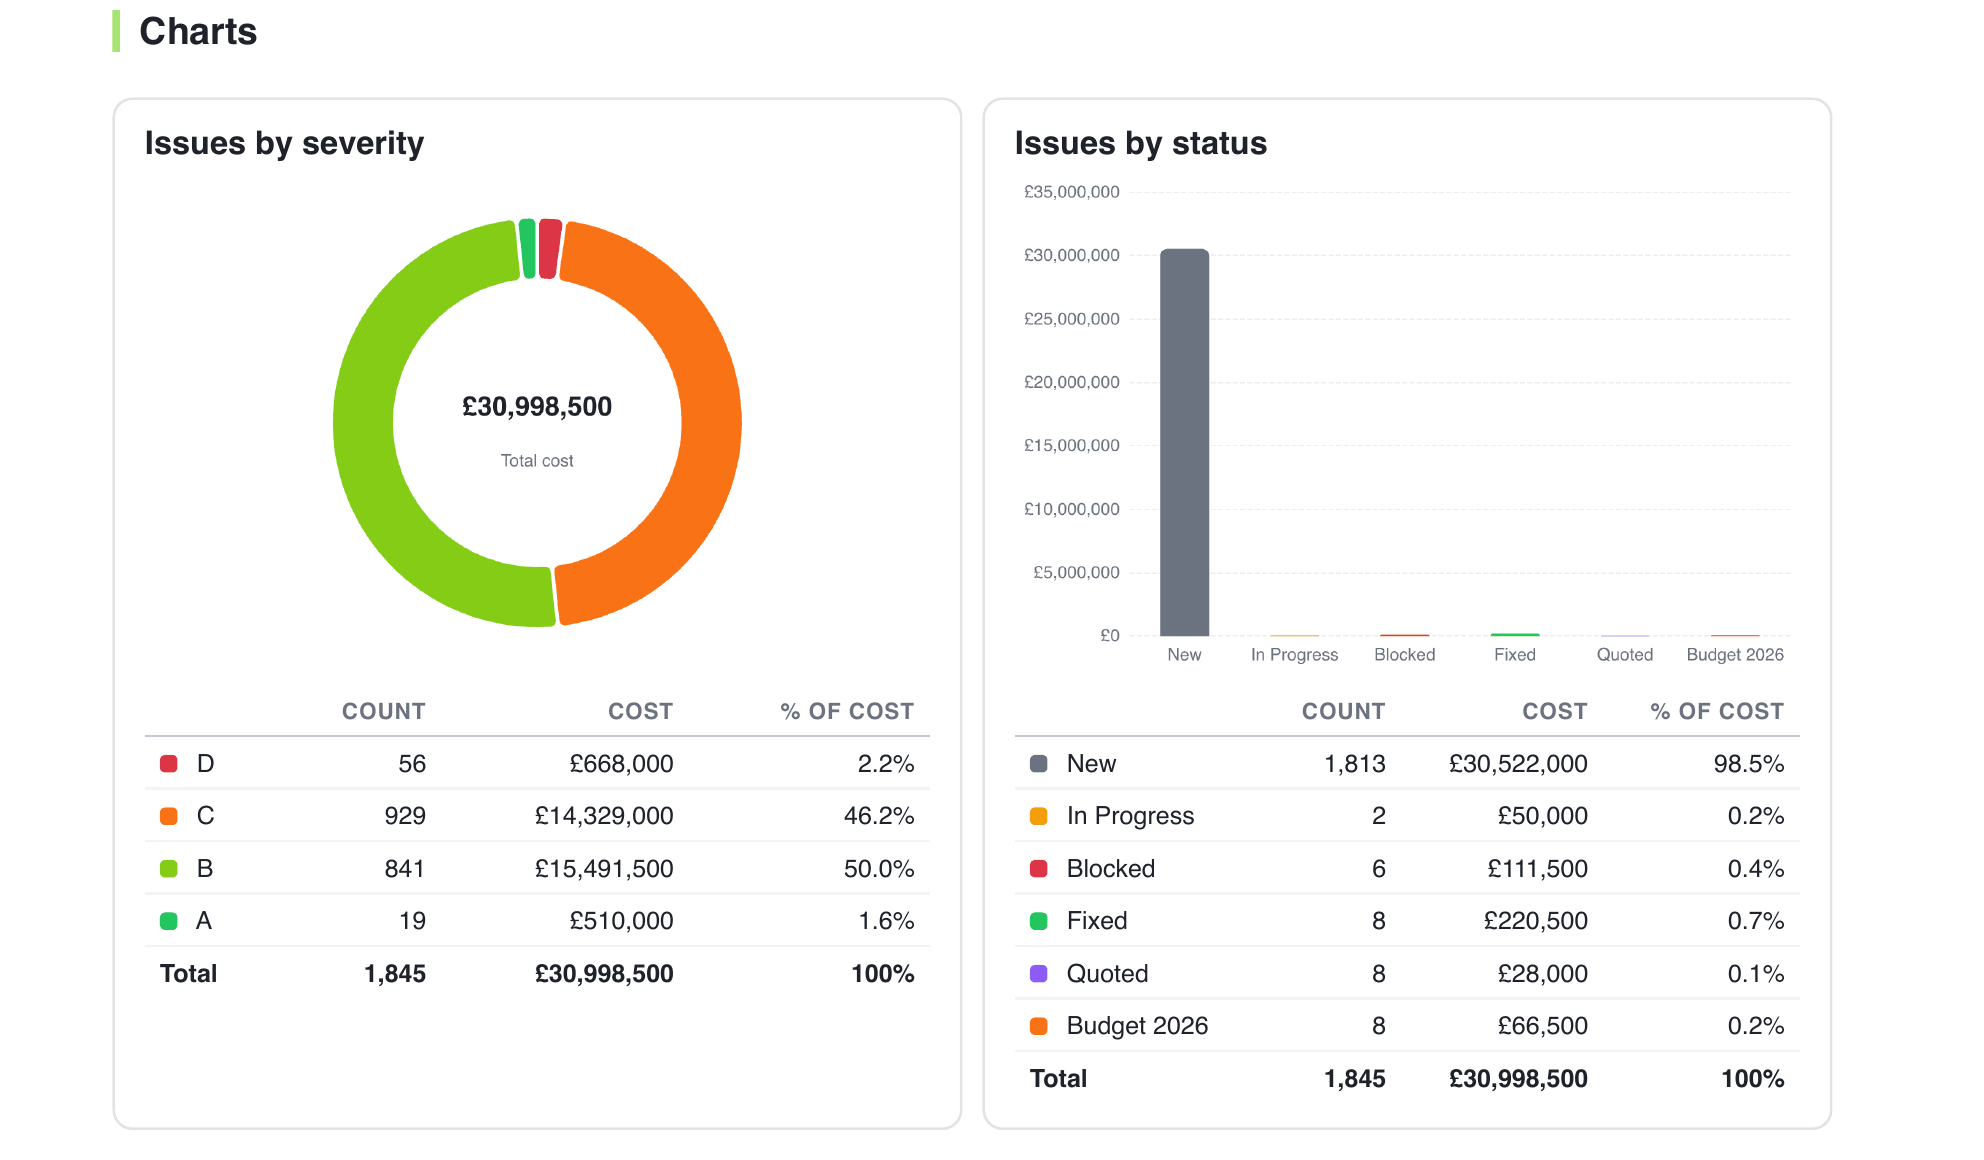
The charts turn the issue grid into pictures: issues by severity, status and priority; cost by condition and programme year; concentration by property; workload by inspector. Where the risk sits and where the money goes stops being a mental exercise and becomes something you can point at.
- A board-ready PDF report with the charts, the totals and the budget line
- Any filtered view downloads to Excel
Running in production
A 60-building education estate runs its condition programme on it
Their surveyors capture condition surveys in Imfuna; the estates team plans, budgets and reports from the dashboard. The quarterly ritual of exporting every survey to Excel and consolidating it by hand is gone - the grid holds the whole programme, and the budget position is always current.
Who it’s built for
Building consultancy & portfolio surveyors
Dilapidations, schedules of condition and planned maintenance across dozens of buildings, where the deliverable is a ranked, costed, budgeted programme.
Estates & asset managers
The people who own the programme and present the options - retrospectively (“what did we spend last year?”) and forward (“what’s left, by severity?”).
Practices with recurring portfolio clients
Clients who each want their own columns, their own cut of the data and their own report - without your team rebuilding a workbook for every one of them.
Lettings & rental portfolio operators
Maintenance triage on any Imfuna platform: every flagged issue from routine visits, check-outs and repairs inspections in one costed grid, one click from the photo evidence.
Questions we get
Which plans include the Portfolio Dashboard?
On Imfuna Surveyor it’s a bolt-on to the Business and Commercial plans: £149 a month for accounts with up to 5 seats, or £299 a month for 6 or more - one price for the whole account. On Imfuna Let it’s the same account pricing as an add-on on Professional (£149) and Business (£299). On Imfuna Surveyor Enterprise it’s included in the custom plan; on Let Enterprise it’s quoted with your plan. It’s not available on the entry plans.
I’m not a surveyor - can I still use it?
Yes. The dashboard attaches to any Imfuna platform - Let, Rent, Surveyor or Home Inspector. If your inspections flag issues - maintenance findings, defects, repairs - they land in the same filterable, costed grid, whatever industry captured them. Pricing sits on each market’s pricing page.
Does it work with surveys we’ve already completed?
Yes. Flagged issues from surveys already in your Imfuna account appear in the grid as soon as the dashboard is switched on - you don’t start from an empty screen.
Can we control who has access to the dashboard?
Yes. Dashboard access is set per user, so you decide who sees it. Surveyors carry on capturing surveys in the app without it, and the people who plan, budget and report on the programme get the full view.
Can we change the columns later?
Yes. Columns can be added or changed at any time, and surveys already in the dashboard update automatically - you’re not locked into your initial setup.
Is there a free trial?
Yes. The first 30 days are free on Business and Commercial, so you can set the dashboard up against surveys already in your account before deciding.
Plans and pricing live on the full pricing page →
See it on a live portfolio
Book a walkthrough and we’ll drive the dashboard on a working portfolio - triage, scenarios, budget and evidence - then talk through how your templates and columns would map onto it. It takes half an hour.